


 Download Free Sample
 Buy Now
Market Size
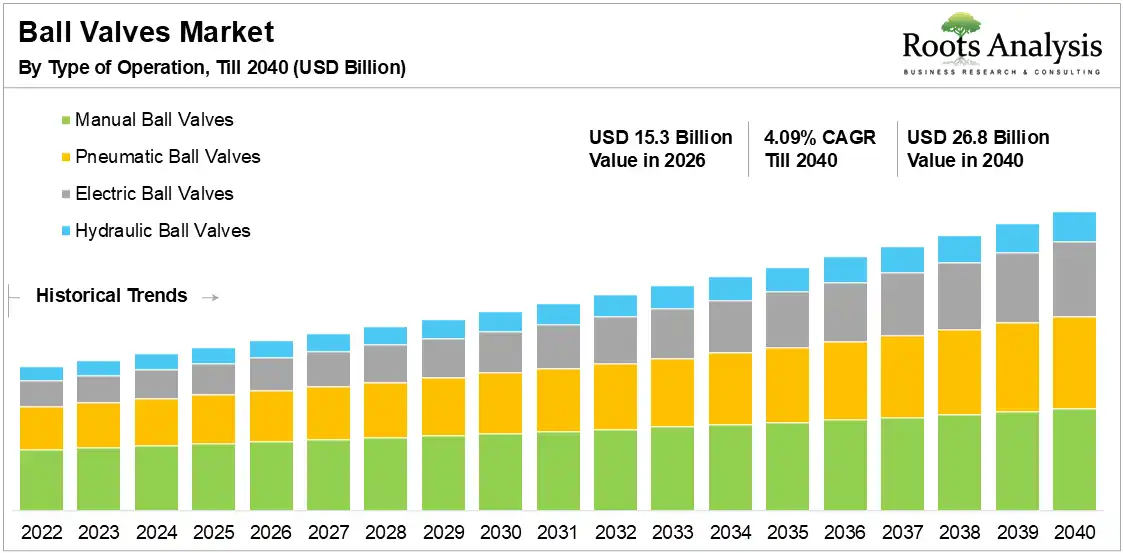
The global ball valves market reached USD 15.3 Billion in 2026 and will grow to USD 26.8 Billion by 2040, registering a CAGR of 4.09% over the forecast period 2026 to 2040, driven by expanding industrial automation and energy infrastructure investments.
See What’s in the Full Report – Request Your Complimentary Insights!
Market Report: Key Takeaways
- Based on valve type, trunnion mounted ball valves capture 34.0% market share in 2026, whereas cryogenic ball valves register a 5.6% CAGR through 2040, supported by LNG infrastructure expansion.
- Based on material type, stainless steel captures 36.0% market share in 2026, whereas alloy-based materials register a 5.0% CAGR through 2040, driven by corrosive industrial applications.
- Based on size, 1 inch to 6 inches captures 38.0% market share in 2026, whereas 26 inches to 50 inches registers a 5.2% CAGR through 2040, supported by pipeline modernization.
- Based on operation type, manual ball valves capture 42.0% market share in 2026, whereas electric ball valves register a 5.8% CAGR through 2040, driven by automation investments.
- On the basis of end user industry, oil and gas captures 32.0% share in 2026, driven by rising demand across upstream production and midstream transmission systems requiring high-performance flow control infrastructure.
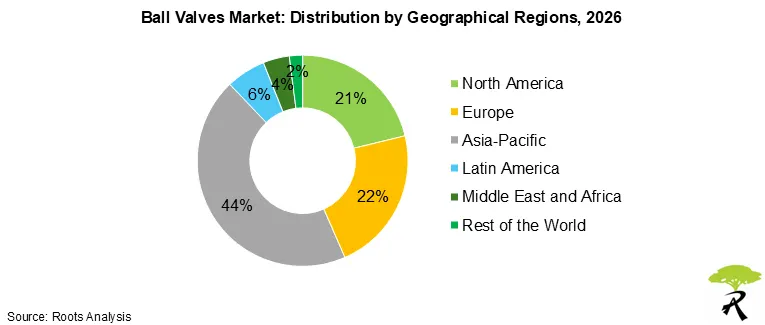
- Based on geography, Asia-Pacific captures 44.0% market share in 2026, whereas Middle East and Africa registers a 5.4% CAGR through 2040, supported by upstream energy investments.
Ball Valves Market Outlook
The ball valves market is moving from basic isolation hardware toward higher-specification flow control across LNG, hydrogen, water, and process plants. Trunnion mounted and cryogenic designs are taking share because operators now prioritize sealing reliability, low emissions, and temperature tolerance over simple shutoff alone. That shift is visible in the 2026 market base and in the 2040 mix, where automation and severe-service use cases shape demand.
Growth now comes from industrial automation, pipeline modernization, and stricter emissions expectations in oil, gas, and chemicals. API-related compliance pressure also matters, because industrial buyers are standardizing valve specifications to reduce leakage risk and approval delays. Utilities and terminal owners also push OEMs toward standardized, faster-to-deploy valve packages. In January 2025, Emerson launched the AEV²XC C-Ball Valve for cryogenic and hydrogen service applications with enhanced emissions reduction capabilities.
Through 2040, the ball valves market will continue to grow at a steady pace. Electric, pneumatic, and cryogenic valves will gain share as operators add remote monitoring, packaged equipment, and low-temperature infrastructure. In February 2025, Flowserve launched Worcester Cryogenic ball valves for LNG, hydrogen, and industrial gas applications. The long-term outlook stays positive as energy transition projects and industrial reliability requirements continue to widen the installed base.
Ball Valves Market Size Estimation Methodology
- As a starting point, we anchored the ball valves market size model to the 2022 to 2040 revenue path supplied in the validated research set. We used the 2026 base value of USD 15.3 Billion and the long-range value of USD 26.8 Billion as the outer guardrails. That let us preserve the supplied CAGR while keeping the model consistent across valve type, material type, size, operation type, end use, and geography.
- Moving forward, we checked trade flow data and industrial procurement patterns for oil and gas pipeline valves, LNG valve infrastructure, and water treatment projects. Those flows help separate routine replacement demand from new-build demand. We gave heavier weight to regions where pipeline modernization, desalination, and industrial automation spend remained visible in project activity.
- Building on this, we used regulatory submission counts and standards-related activity to reflect compliance costs. API references matter because the supplied inputs show a January 2025 rise in regulatory attention around valve specifications and emissions control. That pressure supports premium products, longer qualification cycles, and stronger demand for severe-service designs.
- Drawing upon these inputs, we translated materials production volumes into segment splits for stainless steel, alloy-based materials, cast iron, brass, bronze, and plastic or PVC. Corrosion resistance, pressure tolerance, and low-temperature performance explain why stainless steel leads while alloy-based materials grow faster. This step also keeps the model aligned with chemical, hydrogen, and LNG use cases.
- The projected value was then distributed across size, valve type, and operation type using installed-base logic and project complexity. Medium sizes such as 1 inch to 6 inches keep the largest share, while 26 inches to 50 inches grows faster in pipeline work. Manual valves remain dominant, but electric and pneumatic systems gain share as automation and remote control expand.
- Finally, we stress-tested the forecast against construction cost indices, utility billing data, and long-cycle capital expenditure behavior across energy and water projects. We used those checks to limit overstatement in years when project timing slips or replacement demand pauses. That approach keeps the ball valves market forecast tied to operational reality rather than one-off launch activity and supports segment-level confidence for investors and operators. Those buyers value predictable qualification.
Ball Valves Market Share Insights
Market Share by Type of Valve
According to our market forecast, Trunnion mounted ball valves segment holds the largest share (34%) of the market in 2026. Trunnion mounted ball valves lead because operators prefer high-pressure sealing reliability across oil, gas, and chemical facilities. Large pipeline operators continue replacing legacy gate valves with trunnion designs to reduce leakage risks and maintenance downtime. In February 2025, Emerson expanded severe-service valve solutions for LNG infrastructure.
Meanwhile, cryogenic ball valves segment is likely to grow at a CAGR of 5.6% during the forecast period 2026-2040. This segment registers higher CAGR because LNG trade volumes continue increasing across Asia and Europe. Operators require advanced low-temperature flow control systems for storage terminals and liquefaction projects. In February 2025, Shell highlighted accelerating LNG infrastructure demand through 2040.
Market Share by Operation Type
Based on our analysis, manual ball valves segment occupies 42% of the global market share in 2026. This highest share is largely because industrial operators still favor simple and cost-effective isolation systems. Many developing markets continue prioritizing reliability and low maintenance over automation complexity. In January 2025, AVK expanded manual valve deployments across municipal water systems.
On the other hand, electric ball valves segment is likely to register higher CAGR of 5.8% through 2040. Electric ball valves will accelerate because factories increasingly integrate automated monitoring and remote-control capabilities. Smart manufacturing investments continue driving digital flow-control adoption across industrial facilities. In June 2025, Siemens launched updated industrial automation solutions supporting smart process systems.
Want Information on Specific Region / Segment?
Regional Analysis: Asia-Pacific Holds the Largest Share
Dominant Region: Asia-Pacific, 44.0% Share in 2026
Asia-Pacific leads because China, India, Japan, and Southeast Asia continue expanding industrial and energy infrastructure aggressively. Strong manufacturing ecosystems, growing LNG capacity, and accelerating water treatment investments sustain long-term valve demand. In February 2025, Shell highlighted substantial Asian LNG infrastructure expansion supporting future industrial flow-control investments. Shell LNG outlook for Asia demand growth.
Fastest-Growing Region: Middle East and Africa, 5.4% CAGR Through 2040
The Middle East and Africa region will grow rapidly because governments continue investing heavily in upstream oil, gas, desalination, and industrial diversification projects. Large-scale pipeline construction and petrochemical capacity additions continue supporting advanced valve deployment across the region. In May 2026, Indian energy firms diversified LNG procurement and infrastructure investments amid tightening global supply conditions. Indian LNG infrastructure and procurement activity.
Market Ecosystem Analysis
Ball Valves Market Competitive Landscape
The ball valves market remains highly consolidated around multinational flow-control manufacturers that combine automation software, severe-service engineering, and lifecycle maintenance capabilities. Tier 1 leaders such as Emerson Electric, Flowserve Corporation, and SLB increasingly compete through hardware-software bundling and integrated process-control platforms rather than standalone valve products.
The primary commercial force reshaping competitive behavior is the accelerating demand for digitally monitored, severe-service, and low-emission valve systems across LNG, hydrogen, offshore production, and industrial automation applications. Companies are responding through targeted capacity expansion, smart-valve product launches, and deeper integration into energy-transition infrastructure projects.
Tier 1 Process Automation Suppliers Expanding Severe-Service Valve Portfolios
Leading automation suppliers are broadening severe-service valve offerings to capture higher-margin downstream, LNG, and hydrogen applications.
- Emerson Electric expanded its automation-driven valve strategy through its “Boundless Automation” industrial architecture initiative in February 2025. The initiative emphasized intelligent field connectivity and cloud-enabled operations, increasing demand for digitally integrated valve platforms across process industries.
- Flowserve Corporation remained active in consolidation-led industrial flow control expansion during July 2025 when its previously announced merger agreement with Chart Industries was overtaken by a higher bid from Baker Hughes. The transaction highlighted intensifying competition around LNG, gas handling, and energy-transition infrastructure where advanced valve systems remain strategically important.
Startup Companies Initiatives
The global ball valves market is a rapidly evolving space, attracting not just established industrial giants but also agile startups and emerging players keen on disrupting traditional flow-control solutions.
Key emerging technologies reshaping the landscape include smart valves with IoT capabilities, advanced materials like composites and corrosion-resistant alloys, and artificial intelligence and machine learning for predictive maintenance. Startups are leveraging these trends to carve out niches in sectors ranging from oil & gas and water treatment to pharmaceuticals and renewable energy.
Ball Valves Market Trends
Ball Valves Market Cryogenic and Hydrogen Specifications Reshaping Premium Demand
Low-temperature service is forcing suppliers to redesign sealing systems, metallurgy, and emissions performance. In January 2025, Emerson launched the AEV²XC C-Ball Valve for cryogenic and hydrogen service applications with enhanced emissions reduction capabilities. That raises the premium mix and strengthens suppliers with deep qualification know-how.
LNG infrastructure is also lifting demand for floating and cryogenic products across export terminals and industrial gas systems. In February 2025, Flowserve launched Worcester Cryogenic ball valves for LNG, hydrogen, and industrial gas applications. The commercial result is sharper differentiation around low-temperature reliability.
Ball Valves Market Smart Automation and Multi-Port Designs Increasing Specification
Automation is shifting procurement from simple shutoff valves toward connected flow-control packages. In January 2025, Emerson introduced a fully welded smart ball valve series featuring integrated IoT monitoring for high-pressure oil and gas infrastructure. That move favors vendors that can sell data visibility with hardware.
Multi-port and precise shutoff designs are winning where process flexibility matters. In May 2025, IMI launched the MP Series 5 multi-port ball valve for precise shutoff and industrial flow control applications. That supports higher-margin engineered sales and stronger OEM pull-through.
Your Business is Unique – Why Shouldn’t Your Report Be?
Market Access Considerations
API Compliance and Emissions Certification
API standards shape who can enter the ball valves market and how fast they can scale. The January 2025 regulatory update in the inputs shows a 20% increase in global references to API standards affecting industrial valve specifications and compliance requirements. That raises test, documentation, and approval costs, which favors established manufacturers with qualified quality systems. Smaller vendors face slower commercialization unless they already have certified product lines.
Severe-Service Fabrication and Welding Capacity
Severe-service applications reward suppliers that can weld, test, and certify high-pressure valves at consistent quality. Flowserve’s March 2025 robotic-welding launch for chemical and pharmaceutical use cases illustrates how fabrication capability becomes a market-access filter. Buyers in LNG, hydrogen, and oil pipelines often require proven manufacturing methods before they approve suppliers. That makes plant capability a direct competitive advantage, not just an operational detail.
Direct Sales Engineering Support
Direct sales remain the main route to market because industrial customers buy technical support with the valve. The supplied 2026 mix gives direct sales 46.0% share, which shows how long specification cycles and project customization still matter. Vendors that cannot support sizing, material selection, and aftersales service struggle to win large accounts. Strong direct teams shorten qualification time and strengthen pricing power.
OEM and Channel Integration
OEM access is becoming more important as automation manufacturers package valves into modular systems. The inputs show OEM channels rising from 18.0% share in 2026 to 22.0% by 2040, while online selling grows more slowly from a small base. That shift favors suppliers that can integrate into equipment platforms and meet recurring supply schedules. Channel access increasingly determines whether a vendor sells one-off units or repeat volume, especially in packaged process equipment and automation projects, and it reduces dependence on sporadic project bids.
How Stakeholders Benefit from the Key Focus Areas of Our Ball Valves Market Report
Industrial automation, LNG buildout, and emissions control are reshaping the ball valves market at the same time. That combination makes commercial timing more important for capital allocation, supplier strategy, and product roadmaps. This report helps teams compare segment growth, competitive moves, and investment signals before committing resources.
- Unmet Needs and Market Gaps in Ball Valves Market: The report identifies where existing ball valves fail in cryogenic, hydrogen, and severe-service conditions. It shows which valve types, sizes, and materials still leave performance gaps for project owners and equipment teams. Product leaders can use that to decide where specification upgrades or new variants matter most.
- Funding and Venture Investment Opportunities in Ball Valves Market: The report highlights growth pockets such as cryogenic ball valves, electric ball valves, and OEM-linked automation demand. Investors can use those signals to judge which sub-segments can support premium pricing and faster share gain. Business development teams can also use the same evidence to target partnerships around packaged systems and low-temperature infrastructure.
- Technology Innovation and Adoption Trends: The report tracks adoption of smart ball valves, robotic welding, and integrated IoT monitoring across industrial use cases. Technology teams can use that view to prioritize features that matter in high-pressure oil and gas, chemicals, and pharmaceuticals. It also helps them separate durable adoption trends from one-time product launches.
- Ball Valves Market Competitive Landscape and Industry Analysis: The report maps Tier 1, Tier 2, and emerging suppliers across direct sales, OEM channels, and specialist severe-service niches. Strategy teams can use that structure to benchmark positioning against Emerson, Flowserve, IMI, Trillium, and other validated players. It supports channel planning, pricing decisions, and portfolio gaps analysis.
- Mapping Strategic Partnerships and Ecosystem Synergies: The report shows where valve makers align with LNG operators, hydrogen projects, OEM manufacturers, and process industries. Partnership teams can use that map to identify which ecosystem ties accelerate qualification and shorten sales cycles. It also clarifies where bundled automation and valve packages can create stickier customer relationships.
- Ball Valves CAGR and Growth Trends: The report provides the 2026 to 2040 growth path by segment, region, and end use, including the fastest-expanding categories. Finance teams can use that data to size addressable markets, compare growth rates, and set investment thresholds. Operations and commercial leaders can use the CAGR view to decide where capacity, inventory, and certification spending will pay back fastest.
Ball Valves Market: Scope of the Report
| Key Report Attributes | Details | |
| Forecast Period | Till 2040 | |
| Market Size 2026 | USD 15.3 Billion | |
| Market Size 2040 | USD 26.8 Billion | |
| CAGR (Till 2040) | 4.09% | |
| Segments Covered |
|
|
| Geographical Regions Covered |
|
|
| Key Sections Covered |
|
|
Source: Roots Analysis
Market Segmentation
The ball valves market report presents an in-depth analysis, highlighting the capabilities of various stakeholders, based on different segments such as valve type, material type, size, operation type, distribution channel, end-user industry, geographical regions, and leading players.
By Valve Type
- Floating Ball Valves
- Trunnion Mounted Ball Valves
- Rising Stem Ball Valves
- V-Port Ball Valves
- Multi-Port Ball Valves
- Cryogenic Ball Valves
- Others
By Material Type
- Stainless Steel
- Cast Iron
- Alloy-Based Materials
- Brass
- Bronze
- Plastic / PVC
- Others
By Size
- Up to 1 Inch
- 1 Inch to 6 Inches
- 7 Inches to 25 Inches
- 26 Inches to 50 Inches
- Above 50 Inches
By Operation Type
- Manual Ball Valves
- Pneumatic Ball Valves
- Electric Ball Valves
- Hydraulic Ball Valves
By Distribution Channel
- Direct Sales
- Distributors and Dealers
- OEM Channels
- Online / E-Commerce
By End-User Industry
- Oil and Gas
- Water and Wastewater Treatment
- Energy and Power
- Chemicals and Petrochemicals
- Food and Beverage
- Pharmaceuticals
- Metals and Mining
- Pulp and Paper
By Geographical Regions
- North America
- US
- Canada
- Mexico
- Rest of North America
- Europe
- Austria
- Belgium
- Denmark
- France
- Germany
- Ireland
- Italy
- Netherlands
- Norway
- Russia
- Spain
- Sweden
- Switzerland
- UK
- Rest of Europe
- Asia-Pacific
- Australia
- China
- India
- Japan
- New Zealand
- Singapore
- South Korea
- Rest of Asia-Pacific
- Latin America
- Argentina
- Brazil
- Chile
- Colombia
- Venezuela
- Rest of Latin America
- Middle East and Africa (MEA)
- Egypt
- Iran
- Iraq
- Israel
- Kuwait
- Saudi Arabia
- UAE
- Rest of MEA
- Rest of the World


