


 Download Free Sample
 Buy Now
Market Size
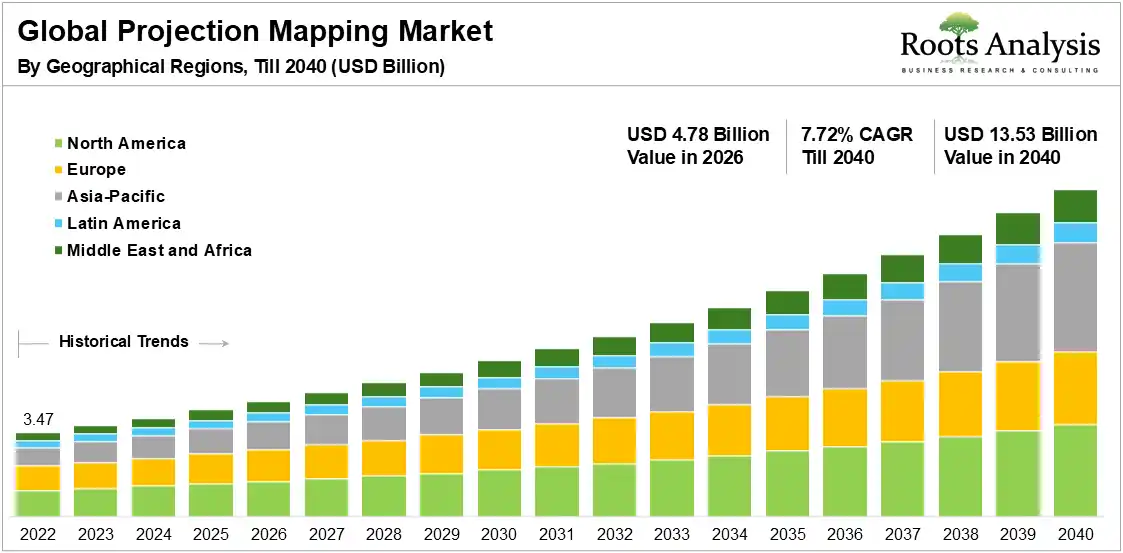
The global projection mapping market is projected to reach USD 4.78 billion in 2026 and USD 13.53 billion by 2040, representing a CAGR of 7.72% during the forecast period 2026 to 2040.
See What’s in the Full Report - Request Your Complimentary Insights!
Market Overview
The projection mapping utilizes specialized software and high-lumen projectors to display high-resolution content onto three-dimensional surfaces, effectively transforming physical structures into immersive digital displays. This sector integrates media servers with advanced calibration tools to serve diverse application areas, including architectural installations, experiential marketing, and large-scale live events.
By seamlessly blending digital media with physical environments, the technology enhances visual aesthetics and audience engagement, creating significant value for stakeholders exploring new frontiers in spatial computing and display integration. Market expansion is primarily fueled by the growing demand for high-impact visual experiences across the entertainment and advertising sectors.
Moreover, the integration of real-time rendering, artificial intelligence (AI) and generative AI for dynamic content creation has shifted the industry toward permanent installations in theme parks, retail, and hospitality. For example, recent developments in laser projection technology have focused on increasing brightness while reducing power consumption, enabling more cost-effective deployment for long-duration architectural projections. This hardware efficiency improves operational viability, accelerating adoption across various commercial landscapes.
Innovation within the projection mapping landscape focuses on simplifying content workflows and enhancing system integration to support hybrid environments. The industry is moving toward sophisticated solutions that combine projection with augmented reality and extended reality to deliver multi-sensory experiences.
Forward-looking initiatives include strategic investments in real-time processing technology to enable interactive, personalized content delivery at a massive scale. As hardware efficiency continues to advance, the projection mapping market outlook remains positive, driven by a sustained global demand for differentiated, immersive commercial experiences.
Market Report: Key Takeaways
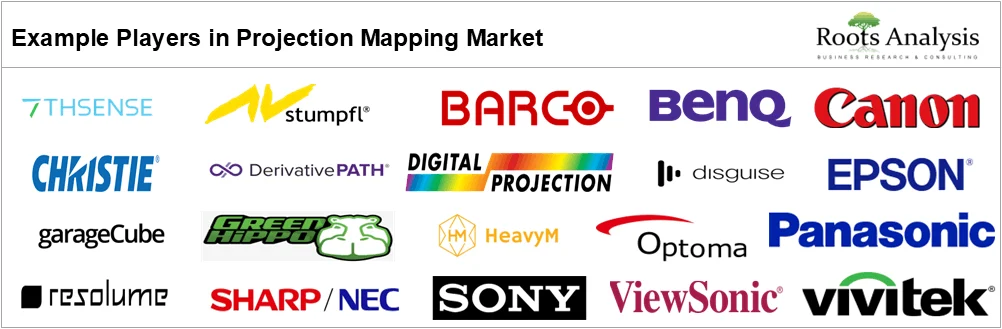
- Leading Players: The market is anchored by well-established players who control the majority of high-lumen laser projector shipments. Epson, Panasonic, Christie Digital, Barco, and Canon are excelling in laser projectors and R&D for 4K / AR integration tailored to enterprise buyers. These firms prioritize geographic expansion and partnerships, holding edges in reliability for large-scale deployments.
- Startup Ecosystem: The startup ecosystem in 2026 is defined by full-stack AI-native companies and specialists in physical AI who are lowering the barrier to entry for complex mapping. Companies like Nextech AR Solutions debuted mini-metaverse projections with spatial mapping, blending AR for immersive retail pilots attractive to seed investors.
- Key Growth Drivers: Market growth is driven by falling laser-projector costs, AI-powered content tools, and rising demand for immersive experiences in events, retail, and public spaces. These factors are making projection mapping industry more attractive to the startups and established players.
- Software Shows Highest Growth Potential: Based on the projection mapping market segmentation analysis, software segment is expanding at a CAGR of 10.1%. This immersive growth potential is due to the growing shift from hardware to intelligent software, integration of AI-assisted calibration and real-time rendering engines.
- Funding and Investment Momentum: The investment landscape for 2026 is characterized by capital concentration and a preference for full-stack AI and deep tech over generic SaaS models. Waymo secured a $16 billion infusion to fuel its autonomous expansion. This is significant for the projection mapping market as autonomous vehicles are increasingly being utilized as "mobile canvases" for city-wide OOH advertising campaigns.
- Regional Insight: Asia-Pacific accelerates at 10.0% CAGR, driven by the rapid urbanization, and China / India infrastructure, offering investors localized supply chain edges.
- Future Trends: Trends include AR / VR hybrids for mixed-reality storytelling, short-throw miniaturization and portable units like Samsung’s Freestyle AI+, generative mapping, and modular Bento workflows that allow creators to LEGO-block complex interactions, reducing technical barriers for non-specialist artists.
Get an Instant Quote in 10 Minutes. Lowest Price Guaranteed
Recent Industry Developments
- February 2026: OOVIE Studios secured €164K in a pre-seed funding round for its interactive music-film platform, highlighting the trend toward generative mapping in the entertainment sector.
- January 2026: TGL and HypGames announced a partnership to license TGL’s custom projection-mapped holes for gaming platforms like Apple Arcade, showing how mapping IP is being monetized across digital ecosystems.
- January 2026: Ross Video returned to Integrated Systems Europe (ISE) with the official launch of the Vertex platform. This platform includes advanced projection mapping, LED mapping, and live entertainment, showcasing synchronized audience experiences.
Market Dynamics
Key Market Drivers
- Escalation of Immersive Experiential Marketing Strategies: Brands are pivotally shifting investment toward high-impact experiential campaigns to achieve market differentiation, moving beyond the saturation of conventional advertising. Projection mapping serves as a sophisticated medium that converts physical structures and environments into dynamic digital canvases, delivering superior audience engagement and organic social shareability compared to traditional flat-panel displays.
- Technological Migration Toward High-Performance Laser Projection: According to the projection mapping industry analysis, the transition from lamp-based systems to solid-state laser technology has fundamentally enhanced the commercial viability of large-scale mapping. By providing intensified brightness, operational lifespans reaching 20,000 hours, and minimized maintenance requirements, laser systems significantly optimize the Total Cost of Ownership (TCO). This technical evolution facilitates sustainable, permanent installations in high-utilization environments such as theme parks and retail flagship stores.
- Diversification into B2B Visualization and Industrial Prototyping: The utility of projection mapping is expanding into industrial value chains, particularly for advanced visualization and rapid prototyping. In the automotive and architectural sectors, designers project digital iterations onto physical scale models, enabling real-time design reviews and accelerated development cycles. This application reduces the reliance on costly physical prototypes while improving collaborative accuracy during the conceptual phase.
- Synergy with Interactive Sensor Suites and IoT Ecosystems: The integration of projection mapping with motion-tracking sensors (Lidar and depth cameras) and haptic feedback is transforming passive viewing into responsive, bidirectional experiences. By allowing real-time audience influence over projected content, these interactive installations drive deeper brand resonance and personalized engagement within corporate, retail, and public-sector deployments.
Market Restraints
- Capital Expenditure Requirements for Premium Hardware The deployment of high-lumen, high-resolution projection systems and the necessary media server infrastructure demands significant upfront capital investment (CAPEX). These substantial entry costs often confine the technology to large-scale enterprises and well-funded production firms, creating a financial barrier for small-to-mid-sized enterprises (SMEs) or short-term projects with restricted budgets.
- Technical Complexity in Calibration and System Integration Executing seamless projection mapping requires specialized engineering expertise to manage geometric correction, edge blending, and content alignment across non-linear surfaces. The precision required to synchronize multiple projectors and adapt to complex 3D topographies necessitates a highly skilled technical workforce, the scarcity and cost of which can impede widespread adoption and project scalability.
- Performance Degradation in High Ambient Light Environments: On the basis of global projection mapping market report, pprojection quality remains highly susceptible to environmental lighting conditions, requiring controlled settings or nighttime operation for maximum visual fidelity. High levels of ambient light, whether from natural solar gain or competing commercial displays can dilute image contrast and impact. This environmental dependency limits the technology’s utility in daytime outdoor settings or brightly lit indoor commercial hubs without prohibitive investment in ultra-high-output systems.
- Resource-Intensive Custom Content Development Pipelines A disproportionate share of project budgets is typically consumed by the creation of bespoke 3D assets tailored to specific surface geometries. Unlike standardized digital signage, projection mapping content is rarely transferable between sites, requiring specialized creative workflows and lengthy production timelines. This lack of content fungibility increases the cost of updates and limits the agility of message deployment.
Pay Only for What You Need – The Best Way to Optimize
Market Share Insights
Projectors Lead the Market by Type of Component
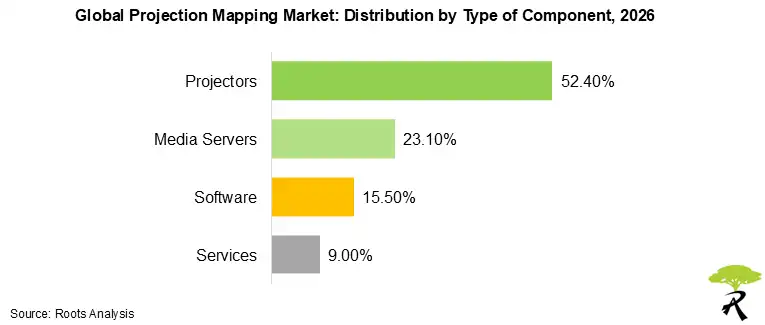
- The component landscape is currently dominated by projectors, holding 52.4% market share as of 2026. However, this sub-segment is projected to experience a relative share loss, dropping to 41.6% by 2040 as the market pivots toward "as-a-service" models and hardware commoditization.
- In contrast, software is positioned as the fastest-growing sub-segment with a CAGR of 10.1% between 2026 and 2040. This growth is propelled by the proliferation of SaaS-based mapping tools and automated AI calibration, shifting the value chain toward high-margin recurring revenue.
- Meanwhile, media servers (8.2% CAGR) and services (9.4% CAGR) are anticipated to grow at an 8.2% and 9.4% CAGR within projection mapping industry by component type. This is driven by the technical demands of 8K real-time playback and the rising complexity of phygital retail consulting. This transition is further evidenced by the January 2026 emergence of "Living Canvas" platforms that utilize edge computing to decentralize processing, signalling a structural move from heavy hardware to intelligent, software-defined ecosystems.
Regional Analysis: North America Leads the Market
The global projection mapping landscape is undergoing a structural reallocation, transitioning from mature hardware-saturated Western markets toward high-growth, infrastructure-heavy emerging economies. Based on the projection mapping market forecast, North America currently maintains the largest market share at 34.5%; however, this dominance is projected to contract to 28.2% by 2040. This anticipated share loss is driven by market saturation in established theme park hubs and a strategic pivot toward software-as-a-service (SaaS) models.
Asia-Pacific: Expected to grow at a Higher CAGR
Asia-Pacific region is positioned as the primary growth engine, forecasted to be the fastest-growing sub-segment with an outsized CAGR of 10.0%. Its market share is expected to surge from 24.2% in 2026 to 33.1% by 2040, fueled by rapid urbanization and the integration of projection mapping into the architectural fabric of smart city experiential hubs.
Want Information on Specific Region / Segment?
Market Ecosystem Insights
Projection Mapping Market Competitive Landscape
The projection mapping competitive landscape is stratified into three tiers: hardware OEM giants who own the high-brightness premium segment; software-native platforms who are capturing the margin and growth; and a long tail of Chinese assemblers competing on price in the sub-10,000 lumen commercial tier.
Based on the competitive analysis of projection mapping companies, majority of the market players and investors concentrate on software-native platforms and building subscription moats that hardware OEMs cannot easily replicate. Some of the examples of leading companies and their key initiatives are mentioned below:
- Panasonic Connect: In early 2026, Panasonic consolidated its lead through a multi-year partnership with the TGL team golf league. Panasonic provided nine flagship PT-RQ50K 4K projectors, each delivering 50,000 lumens, to create a 64-by-53-foot immersive environment at the SoFi Center. Their mission is focused on "simplifying complex workflows" for the entertainment industry.
- Barco: Through its "Laser by Barco" initiative, the Belgian company has focused on educating the cinema and LBE markets on the contrast and color advantages of RGB laser technology. Barco remains a key provider for "large-format staging" and specialized rigging frames.
- MP-STUDIO: A leader in 3D building projection mapping, MP-STUDIO has been recognized for its work in architectural storytelling and interior mapping, pushing the limits of visualization for over a decade.
Funding and Investment Momentum
Investment momentum is currently defined by a "flight to quality," where Venture capital has become more selective, strategic, and focused on startups that demonstrate real-world utility and execution. Moreover, governments are viewing immersive tech as a strategic asset for "tech sovereignty" and economic resilience.
Artificial intelligence is the primary engine of innovation investment. In 2025, AI startups in the US raised a record $164.6 billion, while those in Europe secured $21.6 billion. This trend favors firms like Humans& raised $480 million in a seed round, and specialized immersive specialists like Aircards secured a €3 million investment to scale its brand storytelling capabilities.
Projection Mapping Market Trends and Opportunities
- Innovation in Automated Software-Driven Calibration Tools: The emergence of software utilizing computer vision and 3D scanning is streamlining the historically labor-intensive mapping and calibration process. By automating distortion correction and surface alignment, these tools reduce the dependency on specialized technicians. This democratization of technical execution allows a broader range of creative agencies to integrate immersive projection into their service offerings.
- Untapped Potential in Healthcare and Educational Visualization: New growth pathways are appearing in sectors that prioritize advanced simulation and immersive learning. In healthcare, projection mapping can be utilized for anatomical simulation and therapeutic environment design. In the education sector, it transforms traditional classrooms into immersive, interactive spaces that improve pedagogical outcomes by visualizing complex spatial and historical concepts in three dimensions.
- Transition Toward Managed Services and As-a-Service Business Models: To mitigate the impact of high initial CAPEX, service providers are increasingly adopting subscription-based models that bundle hardware, software, and content creation into predictable operational expenditures (OPEX). This financial shift makes sophisticated mapping solutions more accessible for long-term retail deployments and recurring event cycles, lowering the barrier for entry across diverse industries.
Have Questions? Let’s Get Them Answered.
Projection Mapping Market: Scope of the Report
| Key Report Attributes | Details | |
| Historical Trend | Since 2022 | |
| Forecast Period | Till 2040 | |
| Market Size 2026 | $ 4.78 Billion | |
| Market Size 2040 | $ 13.53 Billion | |
| CAGR (Till 2040) | 7.72% | |
| Segments Covered |
|
|
Market Segmentation
Based on the research, we have segmented the projection mapping market into type of component, type of dimension, type of throw distance, type of technology, type of projection scale, type of installation, application, geographical regions, and leading players.
Market Share by Type of Component
- Projectors
- Media Servers
- Software
- Services
Market Share by Type of Dimension
- 2D Mapping
- 3D Mapping
- 4D / Immersive Mapping
Market Share by Type of Throw Distance
- Short Throw
- Standard Throw
Market Share by Type of Technology
- DLP (Digital Light Processing)
- LCD (Liquid Crystal Display)
- LCoS (Liquid Crystal on Silicon)
Market Share by Type of Projection Scale
- Large Scale Projection
- Small Scale Projection
Market Share by Type of Installation
- Fixed Installations
- Temporary / Event-Based Installations
Market Share by Application
- Entertainment
- Retail and Advertising
- Events and Shows
- Education
- Hospitality
- Automotive
Market Share by Geographical Regions
- North America
- US
- Canada
- Mexico
- Rest of North America
- Europe
- Austria
- Belgium
- Denmark
- France
- Germany
- Ireland
- Italy
- Netherlands
- Norway
- Russia
- Spain
- Sweden
- Switzerland
- UK
- Rest of Europe
- Asia-Pacific
- Australia
- China
- India
- Japan
- New Zealand
- Singapore
- South Korea
- Rest of Asia-Pacific
- Latin America
- Brazil
- Chile
- Colombia
- Venezuela
- Rest of Latin America
- Middle East and Africa (MEA)
- Egypt
- Iran
- Iraq
- Israel
- Kuwait
- Saudi Arabia
- UAE
- Rest of MEA


