


 Download Free Sample
 Buy Now
Market Size
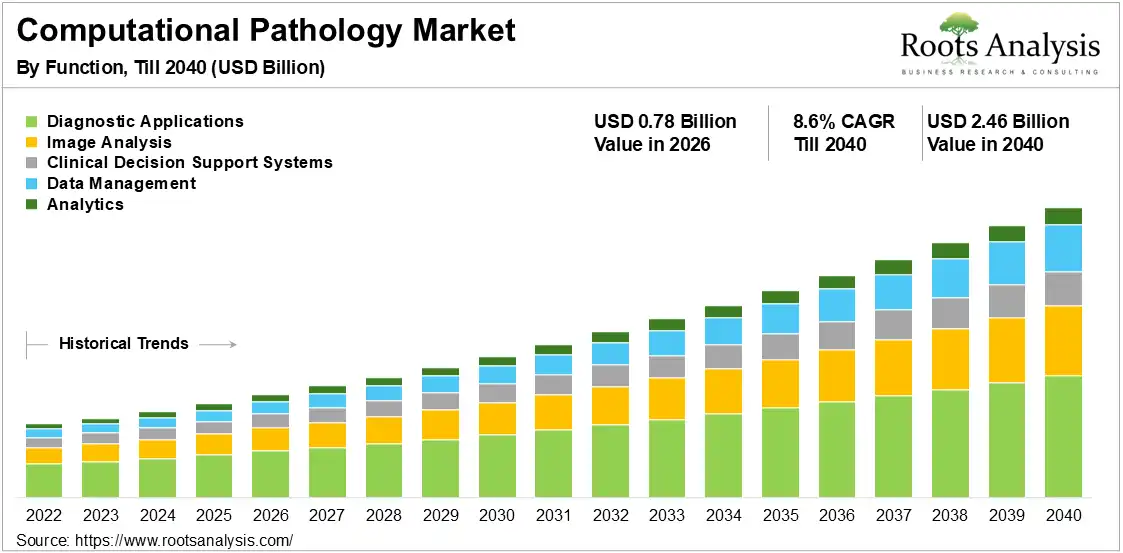
The global computational pathology market is expected to rise from USD 0.78 billion in 2026 to reach USD 2.46 billion by 2040, growing at a CAGR of 8.6% over the forecast period 2026 to 2040, driven by AI-enabled precision diagnostics and scalable digital workflows.
See What’s in the Full Report – Request Your Complimentary Insights!
Market Report: Key Takeaways
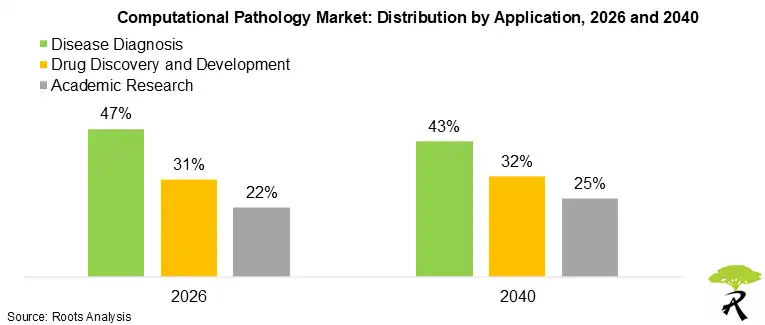
- Based on application, disease diagnosis captures 47.0% market share in 2026, whereas Academic Research registers a 9.5% CAGR through 2040, supported by expanding multimodal pathology datasets.
- Based on technology, machine learning captures 37.0% market share in 2026, whereas Computer Vision registers a 9.8% CAGR through 2040, driven by foundation-model advances in tissue-image interpretation.
- Based on function, image analysis captures 31.0% market share in 2026, whereas Clinical Decision Support Systems register a 10.5% CAGR through 2040, supported by integrated diagnostic workflows.
- Based on therapeutic area, oncology is both the dominant and fastest-growing category, holding 54.0% share in 2026 and expanding at 9.1% CAGR through 2040, driven by companion-diagnostic adoption.
- Based on end user, hospitals capture 43.0% market share in 2026, whereas Pharmaceutical and Biotechnology Companies register a 10.5% CAGR through 2040, supported by biomarker-led clinical development.
Computational Pathology Market Outlook
The computational pathology market is moving beyond isolated image analysis tools. Integrated platforms now combine whole-slide imaging, multimodal models, workflow software, and clinical decision support. Earlier adoption centered on digitizing slides and automating narrow scoring tasks. Current demand increasingly favors enterprise systems that connect diagnosis, biomarker discovery, collaboration, and data management. Pathologist shortages, rising cancer workloads, and growing slide archives now reward vendors that can scale validated algorithms across sites.
Growth now depends on regulatory clearance, hospital deployment, and proof that artificial intelligence improves diagnostic workflows without disrupting governance. FDA decisions are reducing uncertainty for clinical laboratory buyers and strengthening procurement confidence. In June 2025, PathAI received FDA 510(k) clearance for AISight Dx as an image-management system for primary diagnosis in clinical settings. This progress supports wider adoption among hospitals and diagnostic laboratories at scale.
Through 2040, the market will remain high-growth as computer vision, pathology foundation models, and clinical decision support gain share. Pharmaceutical and biotechnology companies will also expand spending on biomarker-led trials and companion diagnostics. In January 2026, AstraZeneca agreed to acquire Modella AI and integrate its pathology foundation models into oncology research and clinical development. Long-term growth will favor interoperable platforms with regulatory credibility and differentiated data access.
Computational Pathology Market Dynamics
Computational Pathology Market Drivers
Regulatory clearance and hospital digitalization are converting pathology AI from pilot projects into clinical infrastructure. Disease diagnosis holds 47.0% of the 2026 market, while hospitals account for 43.0% of end-user demand. In December 2025, FDA clearance expanded HALO AP Dx primary diagnostic use with Leica Biosystems’ Aperio GT 450 DX scanner. Clearer approval pathways now support procurement, deployment, and multi-site standardization.
Computational Pathology Market Restraints
Clinical adoption remains constrained by validation costs, fragmented scanner environments, and limited interoperability across image formats and laboratory systems. Vendors must prove performance across institutions, tissue types, staining variation, and local workflows before routine use. Smaller laboratories face additional capital pressure from scanners, storage, cybersecurity, and quality management. These requirements slow commercialization and favor suppliers with integrated platforms, regulatory experience, and enterprise implementation capacity.
Computational Pathology Market Opportunities
Pharmaceutical biomarker programs create the strongest expansion opportunity beyond routine diagnosis. Pharmaceutical and biotechnology companies will grow at 10.5% CAGR through 2040 as tissue AI supports patient stratification, trial endpoints, and companion diagnostics. In April 2025, Precision for Medicine and PathAI integrated AI pathology with clinical-trial and biospecimen operations. Vendors that connect imaging, molecular data, and trial workflows can capture higher-value contracts.
Computational Pathology Market Challenges
Scaling clinical decision support requires trusted recommendations without weakening pathologist oversight or diagnostic accountability. This function will grow at 10.5% CAGR through 2040, faster than image analysis and diagnostic applications. Laboratories must manage algorithm updates, audit trails, cybersecurity, and performance monitoring across distributed sites. Competitive advantage will depend on transparent models, strong governance, and workflow designs that preserve human review while reducing case turnaround time.
Computational Pathology Market Size Estimation Methodology
- As a starting point, the forecast established the computational pathology market boundary around software, analytics, image-management platforms, and artificial intelligence applications. Broader digital pathology hardware revenues were excluded unless they directly supported computational workflows. Narrow AI-only estimates were reconciled with direct market evidence to avoid overstating the addressable base. This boundary kept scanner infrastructure separate from recurring software and analysis revenues.
- Moving forward, the model reviewed hospital digitization rates, whole-slide scanner installations, diagnostic laboratory adoption, and enterprise pathology platform deployments. These demand indicators were cross-checked against hospital purchasing behavior and reported multi-site implementations. The analysis also considered pathologist workloads and cancer case volumes as structural drivers of clinical use. Adoption assumptions varied by laboratory scale and deployment readiness.
- Building on this, technology shares used product portfolios, regulatory submission counts, clinical clearances, and deployment evidence. Separate weights covered machine learning, computer vision, natural language processing, and multimodal systems. Patent filing volumes and product-launch activity helped test innovation direction. Greater weight favored technologies with clinical integration, model interoperability, and workflow compatibility rather than research-only visibility.
- Drawing upon these, application and end-user forecasts incorporated clinical trial databases, biomarker-development activity, companion-diagnostic programs, academic research spending, and pharmaceutical adoption. Disease diagnosis received the largest 2026 share because hospitals already fund regulated pathology workflows. Faster growth was assigned to academic research and pharmaceutical users because foundation models expand dataset reuse and biomarker discovery. Each assumption was checked against disclosed partnerships and deployments.
- The projected value was then distributed across functions, therapeutic areas, and regions using adoption maturity, regulatory readiness, laboratory infrastructure, and commercialization intensity. Oncology received the highest weight because cancer testing combines established biomarkers, companion diagnostics, and high slide volumes. Regional assumptions also reflected cloud availability, capital access, local health-system modernization, and pathologist supply constraints. Share movements were constrained to preserve realistic adoption curves.
- Finally, annual values were calculated through 2040 using segment-specific growth rates and share-shift assumptions. The model reconciled bottom-up demand indicators with multiple credible secondary sources and tested whether segment totals remained internally consistent. Sensitivity checks examined slower hospital conversion, delayed regulatory approvals, stronger pharmaceutical demand, and faster Asia-Pacific laboratory digitalization before selecting the consensus forecast. Results were rounded only after all segment calculations were completed.
Computational Pathology Market Share Insights
Market Share by Application
According to our analysis, disease diagnosis leads because hospitals already fund scanners, laboratory systems, regulated workflows, and quality-control infrastructure. In April 2025, Roche secured FDA Breakthrough Device Designation for an AI-driven NSCLC companion diagnostic.
Academic Research will grow fastest as foundation models convert slide archives into reusable datasets and biomarker-discovery tools. In July 2025, Mayo Clinic deployed NVIDIA Blackwell infrastructure to advance pathology models and generative medical research.
Market Share by Technology
Machine Learning leads because installed platforms, validated algorithms, and familiar governance frameworks support broad clinical integration. In June 2026, Proscia launched fifth-generation Concentriq with native vision, language, and multimodal model capabilities.
Computer Vision will grow fastest as foundation models improve detection, segmentation, grading, and quantification across whole-slide images. In September 2025, Aiforia launched CE-IVD lymph-node metastasis detection covering three major cancer types.
Want Information on Specific Region / Segment?
Regional Analysis: North America Leads the Market and Asia-Pacific is Likely to Register the Highest CAGR
Presently, North America holds 43.5% market share in 2026. North America leads through mature scanning infrastructure, clear regulatory pathways, strong capital access, and dense academic-commercial networks. Its health systems also maintain large digitized tissue archives suitable for model development and external validation. In September 2025, Proscia expanded its AWS collaboration, enabling scalable cloud storage and analysis for whole-slide pathology data.
In contrast, Asia-Pacific grows at an 11.2% CAGR from 2026 to 2040. Asia-Pacific will grow fastest as hospital digitalization, cancer workloads, and pathologist shortages increase demand for computational support. Policy-backed health modernization and local infrastructure investments will reduce adoption barriers across major regional markets. In January 2026, Sectra began its first Japanese digital pathology implementation to improve cancer diagnosis and treatment speed.
Market Ecosystem Analysis
Under the supplied analyst tiering, eight of 20 companies control most enterprise-scale commercial activity; six specialists and six entrants fragment niches. Acquisition-driven vertical integration now dominates consolidation, demonstrated by Roche’s May 2026 agreement to acquire PathAI for $750 million upfront. Interoperability is the primary commercial force: nearly half of 2025 partnerships linked algorithms, image systems, scanners, or laboratory software. Competitive advantage is shifting toward regulated, workflow-complete platforms combining proprietary datasets, deployment channels, and open integration capabilities.
- In May 2026, Roche agreed to acquire PathAI for $750 million upfront, plus potential milestone payments reaching $300 million.
- In February 2026, PathAI expanded its Labcorp collaboration to deploy FDA-cleared AISight Dx across national laboratories and hospital collaborations.
- In March 2026, Philips announced a cloud-enabled IntelliSite Pathology configuration on HealthSuite, powered by Amazon Web Services.
- In June 2026, Leica Biosystems announced the first Aperio GT Elite deployment within a North American laboratory network.
- In November 2025, Lunit began a Labcorp collaboration combining whole-slide imaging with AI-powered spatial profiling for oncology research.
- In April 2026, Aiforia secured selection as PROSTIA’s AI partner across five additional Paris hospitals.
Startup Companies and their Key Highlights
- Techcyte
- Event type and funding amount: Techcyte completed a $15 million capital raise in April 2026.
- Lead investor and participants: Van Tuyl Companies led the round, with Mayo Clinic and Zoetis participating.
- Stated purpose: Funding supports Fusion’s growth and provides access to more than 17 million de-identified slides and pathology reports.
- Market implication: The event strengthens image analysis, data management, and unified workflows while raising proprietary training-data barriers.
- Mindpeak
- Event type: Mindpeak signed a global reseller agreement in March 2026.
- Strategic partner: Leica Biosystems became the authorized global reseller for Mindpeak applications.
- Stated purpose: The agreement covers nine applications distributed through Aperio HALO AP and the Aperio AI Store.
- Market implication: The agreement accelerates oncology image analysis, biomarker quantification, and global laboratory access through an established scanner ecosystem.
- Nucleai
- Event type: Nucleai and Bio-Techne presented clinical validation data in November 2025.
- Strategic partner: Bio-Techne supplied the spatial biology technology integrated with Nucleai’s AI platform.
- Stated purpose: The workflow identified predictive biomarkers in melanoma patients receiving immunotherapy and targeted therapies.
- Market implication: The collaboration accelerates oncology analytics, spatial biomarker discovery, and drug-development applications for pharmaceutical and biotechnology users.
- aetherAI
- Event type and issue price: aetherAI completed its Taiwan Innovation Board IPO at NT$23.12 per share.
- Month and year: May 2026.
- Stated purpose: The chief executive described the listing as an entry into international capital markets.
- Market implication: The IPO expands capital access for Asia-Pacific commercialization of image management and clinical decision-support systems.
- Qritive
- Event type: Dr Lal PathLabs adopted Qritive’s QAi Lymph Node Dx for routine clinical use in August 2025.
- Stated purpose: The system detects lymph-node metastases, including micrometastases, across multiple cancer types.
- Market implication: The deployment accelerates disease diagnosis, oncology computer vision, and diagnostic-laboratory adoption across India and Asia-Pacific.
Computational Pathology Market Trends / Opportunities
Pathology Foundation Models Expanding Computational Pathology Market Platform Competition
Multimodal models are shifting competitive differentiation from isolated algorithms toward platforms that combine vision, language, workflow, and data services. In June 2026, Proscia introduced fifth-generation Concentriq with native pathology-focused vision, language, and multimodal models. Vendors now compete on platform depth, deployment scale, and model integration.
Large pathology datasets are becoming strategic assets for model training, biomarker discovery, and commercial partnerships. In August 2025, Tempus AI agreed to acquire Paige, gaining almost seven million digitized slides with linked clinical and molecular data. Data ownership will increasingly influence valuation and product performance.
Regulatory Clearances Converting Computational Pathology Pilots into Clinical Procurement
Clinical clearances are reducing buyer uncertainty and moving pathology AI into primary diagnostic workflows. In June 2025, PathAI received FDA 510(k) clearance for AISight Dx as an image-management system for primary diagnosis. Regulatory maturity now strengthens hospital procurement and favors vendors with quality-management experience.
Scanner compatibility and approved image formats are becoming important commercialization requirements. In December 2025, clearance covered HALO AP Dx with Leica Biosystems’ Aperio GT 450 DX scanner using SVS and DICOM images. Vendors with validated hardware-software combinations can scale faster across regulated laboratories.
Biomarker-Led Drug Development Reshaping Revenue Mix and Strategic Value
Pharmaceutical demand is expanding computational pathology beyond routine diagnosis into trial design, patient selection, and companion diagnostics. In May 2026, Roche agreed to acquire PathAI for USD 750 million upfront, with potential milestones reaching USD 300 million. Strategic buyers increasingly value integrated diagnostic and biomarker capabilities.
Clinical-trial service integration is creating recurring demand for tissue analytics and biospecimen-linked insights. In April 2025, Precision for Medicine and PathAI connected AI pathology with clinical-trial and biospecimen operations. Suppliers that embed analysis into development workflows can secure broader, longer-duration contracts.
Regional Laboratory Digitalization Opening New Commercial Pathways
Asia-Pacific adoption is accelerating as health systems modernize cancer diagnostics and address pathologist shortages. In January 2026, Sectra began its first Japanese digital pathology implementation to improve diagnosis and treatment speed. Local implementation experience will become a major differentiator for international platform providers.
Middle Eastern reference laboratories are also adopting artificial intelligence within established clinical workflows. In June 2026, M42’s National Reference Laboratory integrated Qritive’s prostate module at Cleveland Clinic Abu Dhabi. Regional partnerships can shorten market entry and provide visible validation for emerging vendors.
Your Business is Unique – Why Shouldn’t Your Report Be?
Market Access Considerations
Scanner Interoperability and Image-Format Compatibility
Access depends on reliable operation across scanners, image formats, laboratory systems, and multi-site workflows. Proprietary environments can restrict addressable customers, while validated interoperability lowers implementation risk and supports faster scaling. In December 2025, clearance covered HALO AP Dx with Leica Biosystems’ Aperio GT 450 DX scanner using SVS and DICOM formats. Broad compatibility strengthens vendor positioning in enterprise tenders overall. It also reduces switching costs for laboratories with mixed infrastructure across multiple sites globally.
Digitized Slide Data and Linked Clinical Evidence
High-performing models require large, diverse slide collections linked with clinical, molecular, and outcome data. Limited access to such datasets raises training costs and weakens external validation across institutions. In August 2025, Tempus AI agreed to acquire Paige, gaining almost seven million digitized slides with linked clinical and molecular data. Proprietary datasets can improve model differentiation and strategic value. Competitors must secure partnerships or build equivalent evidence over several development cycles independently.
Enterprise Deployment Capacity and Workflow Integration
Commercial access increasingly depends on implementation teams, cloud infrastructure, cybersecurity controls, and workflow integration across hospital networks. Buyers favor suppliers that can support governance, training, upgrades, and consistent performance across sites. In June 2025, Northwestern Medicine began deploying PathAI’s AISight platform across 95 pathologists and 11 hospitals. Proven enterprise deployment improves renewal prospects and competitive credibility. Smaller vendors may need platform partnerships to match this delivery capacity in complex networks globally today.
How Stakeholders Benefit from the Key Focus Areas of Our Computational Pathology Market Report
Regulatory clearances, hospital digitalization, and pathology foundation models are making computational pathology commercially urgent. The report connects adoption evidence, competitive moves, and segment forecasts to support capital allocation, market entry, product planning, and partnership decisions.
- Unmet Needs and Market Gaps in Computational Pathology Market: The analysis identifies gaps in scanner interoperability, multi-site validation, clinical governance, and pathologist workflow integration. Hospital executives can compare these barriers against deployment readiness and procurement priorities. Product teams can determine where image management, auditability, and decision support remain underserved. These findings support decisions on platform design, clinical evidence, and targeted market entry.
- Funding and Venture Investment Opportunities in Computational Pathology Market: The report tracks capital signals across platform software, clinical artificial intelligence, and biomarker infrastructure. In April 2026, Techcyte raised USD 15 million to expand its Fusion platform and AI development. Investors and corporate development teams can compare funding activity with regulatory maturity and deployment traction. This supports capital allocation and acquisition screening.
- Technology Innovation and Adoption Trends: Computer vision will grow at 9.8% CAGR, while clinical decision support systems will expand at 10.5% through 2040. In June 2026, Proscia introduced Concentriq with native vision, language, and multimodal models. Technology teams can assess which capabilities are gaining clinical relevance. The analysis supports roadmap sequencing, integration choices, and development spending.
- Computational Pathology Market Competitive Landscape and Industry Analysis: The competitive review maps 20 companies across enterprise platforms, scanners, clinical AI, and specialist analytics. In May 2026, Roche agreed to acquire PathAI, strengthening its digital pathology and companion-diagnostics position. Corporate strategy teams can compare product breadth, regulatory maturity, and ecosystem roles. This supports build, buy, partner, and differentiation decisions.
- Mapping Strategic Partnerships and Ecosystem Synergies: The report shows how platform vendors, algorithm developers, hospitals, and pharmaceutical companies combine capabilities. In March 2026, Aiforia and Proscia partnered to integrate diagnostic AI applications with the Concentriq platform. Business development teams can identify complementary partners and credible routes to clinical deployment. The mapping supports alliance prioritization and commercial due diligence.
- Computational Pathology Market CAGR and Growth Trends: The market will expand at 8.6% CAGR from 2026 to 2040, with major differences across segments. Asia-Pacific will grow at 11.2%, while pharmaceutical and biotechnology companies will expand at 10.5%. Finance and planning teams can compare growth with adoption barriers and competitive intensity. These forecasts support regional investment, sales capacity, and portfolio prioritization.
Computational Pathology Market: Scope of the Report
| Key Report Attributes | Details | |
| Forecast Period | Till 2040 | |
| Market Size 2026 | USD 0.78 Billion | |
| Market Size 2040 | USD 2.46 Billion | |
| CAGR (Till 2040) | 8.6% | |
| Segments Covered |
|
|
| Geographical Regions Covered |
|
|
| Key Sections Covered |
|
|
Market Segmentation
The Computational Pathology Market report presents an in-depth analysis, highlighting the capabilities of various stakeholders, based on different segments, such as application, technology, function, therapeutic area, end user, geographical regions, and leading players.
By Application
- Disease Diagnosis
- Drug Discovery and Development
- Academic Research
By Technology
- Machine Learning
- Natural Language Processing
- Computer Vision
- Others
By Function
- Diagnostic Applications
- Image Analysis
- Clinical Decision Support Systems
- Data Management
- Analytics
By Therapeutic Area
- Oncology
- Hematology
- Gastroenterology
- Infectious Diseases
- Neurology
- Others
By End User
- Hospitals
- Diagnostic Laboratories
- Pharmaceutical and Biotechnology Companies
- Academic and Research Institutes
By Geographical Regions
- North America
- US
- Canada
- Mexico
- Rest of North America
- Europe
- Austria
- Belgium
- Denmark
- France
- Germany
- Ireland
- Italy
- Netherlands
- Norway
- Russia
- Spain
- Sweden
- Switzerland
- UK
- Rest of Europe
- Asia-Pacific
- China
- India
- Japan
- Singapore
- South Korea
- Rest of Asia-Pacific
- Latin America
- Argentina
- Brazil
- Chile
- Colombia
- Venezuela
- Rest of Latin America
- Middle East and Africa (MEA)
- Egypt
- Iran
- Iraq
- Israel
- Kuwait
- Saudi Arabia
- UAE
- Rest of MEA
- Rest of the World


