


 Download Free Sample
 Buy Now
Market Size
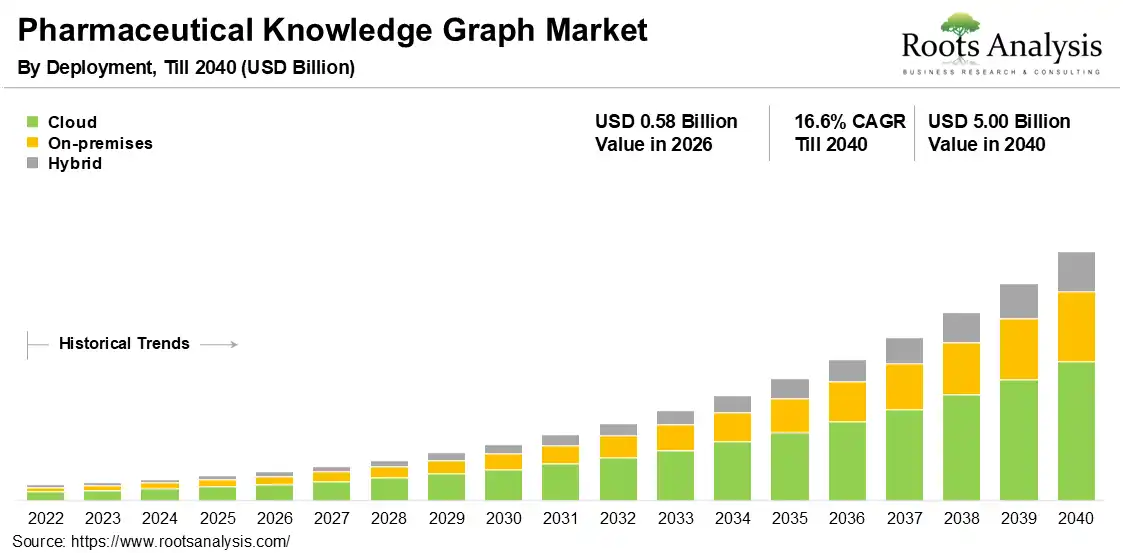
The global pharmaceutical knowledge graph market reached USD 0.58 billion in 2026 and is projected to reach USD 5.00 billion by 2040, growing at a CAGR of 16.6% over the forecast period 2026 to 2040, driven by growing demand for explainable AI and connected biomedical evidence.
See What's in the Full Report – Request Your Complimentary Insights!
Market Report: Key Takeaways
- Based on offering, knowledge graph platforms capture 34.0% market share in 2026, whereas semantic enrichment and ontology-management tools register a 17.8% CAGR through 2040, supported by growing demand for governed biomedical semantics.
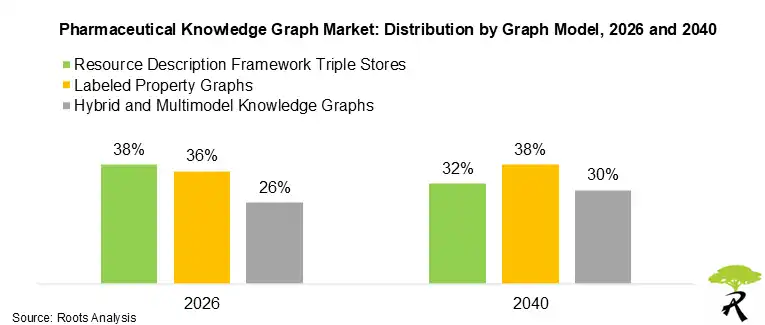
- Based on graph model, RDF triple stores capture 38.0% market share in 2026, whereas hybrid and multimodel knowledge graphs register a 17.8% CAGR through 2040, reflecting demand for flexible data and AI architectures.
- Based on deployment, cloud is both the dominant and fastest-growing category, holding 56.0% share in 2026 and expanding at 17.9% CAGR through 2040, driven by scalable data integration and managed AI infrastructure.
- Based on application, target identification and validation captures 24.0% market share in 2026, whereas drug repurposing and indication expansion registers a 17.9% CAGR through 2040, supported by evidence-based hypothesis generation.
- Based on geography, North America captures 43.0% market share in 2026, whereas Asia-Pacific registers a 19.6% CAGR through 2040, supported by expanding AI infrastructure and pharmaceutical digitalization.
Pharmaceutical Knowledge Graph Market Outlook
The pharmaceutical knowledge graph market is shifting from standalone graph databases toward integrated scientific decision platforms. Buyers now demand semantic search, reasoning, visualization, provenance, and workflow automation within one governed environment. Agentic AI and GraphRAG are raising performance expectations, while fragmented ontologies and inconsistent entity resolution still slow deployment. This transition favors vendors that combine curated biomedical evidence, scalable graph infrastructure, and pharmaceutical workflow expertise.
Current growth comes from rising demand for explainable AI, connected internal data, and traceable evidence across regulated research workflows. Pharmaceutical teams need consistent terminology and cited reasoning for target, safety, regulatory, and medical decisions. This requirement strengthens demand for pharmaceutical ontology management software and controlled semantic data integration. In June 2026, Causaly and Microsoft linked scientific computation with knowledge-graph reasoning for governed life-sciences research and development workflows.
Through 2040, the market will remain high-growth as cloud delivery, hybrid graph models, and real-world evidence expand adoption. Hybrid architectures will connect triples, property graphs, vectors, documents, and analytical outputs without duplicating data. They will also widen access for biotechnology companies. In May 2026, QIAGEN and NVIDIA agreed to combine BioNeMo with curated biomedical knowledge graphs for disease, target, and biomarker research. Long-term growth should remain strong but increasingly selective.
Pharmaceutical Knowledge Graph Market Dynamics
Pharmaceutical Knowledge Graph Market Drivers
Explainable AI and connected biomedical evidence will sustain 16.6% annual growth through 2040. Target identification and validation holds 24.0% share in 2026 because graph reasoning connects genetics, pathways, compounds, safety findings, and experiments. Cloud deployment strengthens this demand by supporting frequent updates and elastic analytics. Pharmaceutical knowledge graph market growth therefore depends on platforms that convert fragmented evidence into traceable, repeatable scientific decisions.
Pharmaceutical Knowledge Graph Market Restraints
Fragmented terminology and uneven data quality remain the primary adoption restraints. Scientific literature, patents, omics, clinical trials, laboratory records, and safety data use different identifiers and evidence structures. Buyers must invest in entity resolution, ontology alignment, provenance controls, and expert validation before scaling. On-premises deployment falls from 28.0% share in 2026 to 20.0% by 2040, reflecting the cost and complexity of maintaining isolated infrastructure.
Pharmaceutical Knowledge Graph Market Opportunities
Drug repurposing and indication expansion create the clearest commercial opportunity, growing at 17.9% annually through 2040. Knowledge graph embeddings can connect existing compounds with pathways, phenotypes, diseases, safety findings, and competitive pipelines. In February 2025, Data4Cure and Pfizer began a multi-year partnership covering targets, biomarkers, disease mechanisms, and indication expansion. Vendors that link internal evidence with multi-omics data can win broader research programs.
Pharmaceutical Knowledge Graph Market Challenges
Multimodel integration will challenge vendors as pharmaceutical workloads combine RDF triples, property graphs, vectors, documents, and analytical outputs. RDF triple stores hold 38.0% share in 2026, while hybrid and multimodel graphs grow fastest at 17.8% annually. Technology leaders must preserve semantic interoperability without slowing GraphRAG retrieval or duplicating data. Competitive advantage will depend on architecture, governance, and implementation skills rather than database performance alone.
Pharmaceutical Knowledge Graph Market Size Estimation Methodology
- As a starting point, the analysis fixed the pharmaceutical knowledge graph market boundary around software, data products, and services. Included categories covered graph platforms, databases, curated biomedical products, semantic tools, ontologies, GraphRAG, integration, and support. Generic AI drug-discovery vendors without an identifiable knowledge graph capability were excluded. This scope prevented adjacent analytics software from inflating the addressable market.
- Moving forward, vendor product pages and commercial deployment disclosures established the active supplier base and current adoption patterns. Evidence covered graph infrastructure, pharmaceutical intelligence platforms, ontology management, semantic enrichment, and pharmacovigilance applications. Partnership announcements and funding events helped distinguish scalable commercial activity from early product positioning. Named customer agreements indicated repeat use across preclinical and enterprise research organizations.
- Building on this, demand was mapped across offering, graph model, deployment, application, data source, end user, and geography. The model used scientific literature, patents, omics, clinical trials, real-world records, laboratory data, safety information, and pipeline intelligence. Segment shares reflected procurement maturity, installed infrastructure, workflow importance, and data-governance requirements. This structure separated commercial software growth from data and services demand.
- Drawing upon these inputs, segment growth rates were assigned from adoption direction and competitive evidence. Cloud gained weight because managed infrastructure supports frequent updates, elastic analytics, distributed teams, and generative AI services. Hybrid graphs, ontology tools, drug repurposing, real-world data, biotechnology users, and Asia-Pacific received higher growth assumptions. Regional assumptions also considered local implementation capacity and partner ecosystems.
- The projected value was then calculated through a top-down forecast anchored to the overall 16.6% compound annual growth rate. Annual estimates followed a consistent acceleration path from 2026 through 2040, while segment totals remained equal to the market total. Share gains and losses were reconciled against each category's relative growth rate. The model avoided abrupt changes unsupported by adoption evidence.
- Finally, the forecast was triangulated against multiple credible secondary sources, supplier disclosures, deployment evidence, funding signals, and technology launches. Checks tested whether platform leadership, cloud adoption, RDF maturity, multimodel growth, and regional expansion aligned across independent inputs. The final model preserved internal consistency between annual totals, segment shares, and calculated compound growth rates. Sensitivity checks tested faster and slower adoption around the base case.
Pharmaceutical Knowledge Graph Market Share Insights
Market Share by Graph Model
According to our analysis, RDF triple stores lead in 2026 because pharmaceutical ontologies, linked-data standards, and semantic interoperability frameworks have established a mature installed base. Their standardized subject-predicate-object structure also supports regulated data exchange and cross-database reasoning. In June 2026, Causaly and Microsoft announced a governed scientific decision environment combining computation with knowledge-graph reasoning. The approach connects internal and external sources while preserving cited evidence and provenance.
Hybrid and multimodel knowledge graphs will grow fastest because pharmaceutical workloads combine semantic triples, property graphs, vectors, documents, and analytical outputs. Multimodel architectures reduce data duplication and support both standards-based interoperability and high-performance AI retrieval. Neo4j launched Infinigraph in September 2025, combining transactional and analytical graph workloads within a distributed architecture exceeding 100 terabytes. The system also stores document vectors directly within connected graph structures.
Market Share by Deployment
Cloud deployment leads because knowledge graphs require scalable storage, frequent data updates, elastic analytics, and integration with generative AI services. Cloud delivery also reduces infrastructure management burdens for biotechnology companies and distributed research teams.
Causaly announced its agentic AI research platform in September 2025, enabling scientists to combine internal and external data through an integrated environment. The platform supports scalable workflows, continuous evidence scanning, and connections with external applications.
Cloud adoption will gain further share as pharmaceutical companies standardize graph services across discovery, clinical, safety, and commercial functions. Managed environments also support faster deployment, centralized governance, and controlled access across partners and research locations. Neo4j expanded its Asia-Pacific partner infrastructure in August 2025, citing growing demand for graph-powered AI and data integration. The initiative strengthened local implementation capacity and enterprise access to graph technologies.
Want Information on Specific Region / Segment?
Regional Analysis: North America Leads the Market and Asia-Pacific is Likely to Register Higher CAGR
North America holds 43.0% share in 2026. North America leads through mature pharmaceutical research infrastructure, deep venture capital access, strong cloud adoption, and extensive biomedical data assets. The region also contains major graph technology vendors, AI developers, pharmaceutical companies, and specialized implementation partners. In June 2026, Microsoft and Causaly announced an integration connecting scientific computation with knowledge-graph reasoning for life-sciences research. The collaboration links enterprise analytics with cited evidence, mechanistic reasoning, and governed decision workflows.
Asia-Pacific will grow at a CAGR of 19.6% till 2040. Asia-Pacific will grow fastest as pharmaceutical digitalization expands across China, Japan, India, South Korea, Singapore, Australia, and Southeast Asia. Local cloud capacity, research investments, genomic programs, and regional technology partnerships will support faster knowledge graph deployment. Neo4j announced a broader Indonesian partner ecosystem in August 2025, strengthening graph implementation and support capabilities across the market. The expansion addressed rising regional demand for connected data, transparent AI, and enterprise knowledge infrastructure.
Market Ecosystem Analysis
The Tier 1 leaders account for most identifiable activity, with ten specialists and five emerging entrants across 25 companies. Platform convergence now dominates, combining graph databases, vector retrieval, curated biomedical evidence, and workflow-specific agentic AI within unified offerings. Evidence-grounded GraphRAG is the main commercial force, as pharmaceutical buyers seek traceable answers without specialist graph-modeling expertise. Advantage now shifts toward vendors connecting trusted content, proprietary data, and deployable workflows, as Causaly's June 2025 launch illustrates.
- Amazon Web Services: AWS made Bedrock Knowledge Bases GraphRAG generally available with Neptune Analytics in March 2025. It automatically constructs entity graphs and embeddings, lowering graph-modeling barriers for cloud pharmaceutical teams. This pressures standalone engines by making graph construction a managed feature rather than a specialist implementation project. The release strengthens cloud deployment, hybrid graph models, literature integration, and regulatory or medical intelligence applications.
- Oracle Corporation: Oracle integrated Graph RAG with operational property graphs and RDF knowledge graphs inside its database in November 2025. This reduces data movement and pressures specialist databases competing through security, governance, and enterprise integration. The development strengthens hybrid deployment, multimodel graph architectures, and internal laboratory or commercial data applications.
- Neo4j: Neo4j updated its LLM Knowledge Graph Builder in February 2025, adding community summaries, parallel retrievers, and broader model support. The update lowers text-to-graph development effort while defending Neo4j against hyperscalers offering managed GraphRAG. It strengthens graph database engines, scientific literature ingestion, and competitive intelligence workflows.
- Causaly: Causaly launched Pipeline Graph in June 2025, placing competitive pipeline intelligence within early target evaluation workflows. The application pressures general search vendors by combining 500 million facts with directional relationships and monthly updates. It strengthens target validation, indication expansion, competitive intelligence, and commercial pipeline data segments.
- BenchSci: BenchSci signed a three-year Sanofi agreement in October 2025 to deploy ASCEND across global preclinical research. ASCEND combines public evidence with internal data, raising barriers for platforms lacking proprietary preclinical context. The deployment strengthens preclinical research, disease biology, internal experimental data, and pharmaceutical-company adoption.
- Data4Cure: Data4Cure began a multi-year Pfizer collaboration in February 2025 using CURIE Knowledge Graph and multimodal data integration. This validates specialist platforms at global-pharma scale and pressures tools limited to public literature or single-omics evidence. It strengthens targets, biomarkers, disease mechanisms, indication expansion, and omics-based knowledge products.
- Graphwise: Graphwise supported Oxford Drug Discovery Institute with a customized Alzheimer's research knowledge graph in March 2025. The deployment reduced evaluation of 54 genes from weeks to days, demonstrating measurable workflow value. It strengthens target identification, biomarker discovery, scientific literature integration, and academic end-user adoption.
- ONTOFORCE: ONTOFORCE enhanced DISQOVER cohort-building functionality in April 2025, adding SDTM ingestion, privacy controls, and comparative filtering. This moves semantic integration closer to clinical analysis and raises expectations for regulated-data readiness. The release strengthens clinical trial intelligence, real-world data integration, hybrid deployment, and healthcare-provider applications.
- QIAGEN Digital Insights: QIAGEN acquired Genoox for $70 million in May 2025, adding the Franklin cloud platform to Digital Insights. The transaction creates integration pathways between Franklin, QIAGEN Knowledge Base, COSMIC, and HGMD. It pressures curated-data rivals by bundling genomic interpretation, precision medicine, cloud delivery, and clinical decision support.
Startup Companies and their Key Highlights
- Causaly
- Event type: Product launch, Pipeline Graph
- Month and year: June 2025
- Stated purpose: Integrate competitive pipeline intelligence into early-stage target evaluation for research scientists.
- Market implication: Accelerates target validation, indication expansion, and portfolio intelligence by connecting biomedical evidence with development pipelines.
- Data4Cure, Inc.
- Event type: Multi-year strategic collaboration
- Month and year: February 2025
- Strategic partner: Pfizer
- Stated purpose: Apply CURIE Knowledge Graph and multimodal integration to mechanisms, subtypes, targets, biomarkers, and indication expansion.
- Market implication: Validates specialist knowledge graphs at global-pharma scale and strengthens omics, target discovery, and biomarker applications.
- Valo Health
- Event type and potential value: Research collaboration with potential payments exceeding $3 billion
- Month and year: November 2025
- Strategic partner: Merck KGaA
- Stated purpose: Discover therapeutic molecules for Parkinson's disease and related neurological conditions.
- Market implication: Accelerates target identification and precision medicine using longitudinal patient data and human biological evidence.
- Graph AI
- Event type and funding amount: Seed funding, $3 million
- Month and year: October 2025
- Lead investor: Bessemer Venture Partners
- Stated purpose: Fund product innovation, engineering expansion, and global adoption of Graph Safety.
- Market implication: Accelerates pharmacovigilance, adverse-event processing, signal detection, and regulatory reporting across major pharmaceutical regions.
- Elucidata
- Event type: Strategic partnership
- Month and year: June 2025
- Strategic partner: Sapien Biosciences
- Stated purpose: Convert biobank assets into AI-ready multimodal data products for drug and diagnostic development.
- Market implication: Strengthens biomarker discovery, precision medicine, and real-world data applications while expanding Asia-Pacific biomedical data availability.
Pharmaceutical Knowledge Graph Market Trends / Opportunities
Agentic Scientific Workflows Expanding Pharmaceutical Knowledge Graph Market Platform Value
Agentic systems are moving biomedical knowledge graphs from search tools into governed workflow engines. Causaly introduced Scientific Workflows in May 2026 to convert expert research methods into repeatable, evidence-backed processes. Vendors that codify target, indication, and safety assessments can expand platform value and user retention.
Scientific computing integrations are joining prediction and simulation with cited graph reasoning. Causaly and Microsoft connected these capabilities in June 2026 for governed life-sciences research and development decisions. This integration pattern favors platforms that connect analysis outputs directly with traceable biomedical evidence.
Specialized AI agents are becoming embedded features within established drug-discovery platforms. Insilico Medicine launched PandaClaw within PandaOmics in March 2026, combining agents, biological workflows, and biomedical graph access. Competitive differentiation will increasingly depend on workflow quality, evidence transparency, and domain-specific automation.
Multimodel Graph Architectures Reshaping Pharmaceutical Knowledge Graph Market Competition
Hybrid architectures are gaining because pharmaceutical workloads combine semantic triples, property graphs, vectors, documents, and analytical outputs. Neo4j launched Infinigraph in September 2025 for distributed transactional and analytical workloads exceeding 100 terabytes. Vendors that support multimodel retrieval can address larger enterprise workloads without duplicating connected data.
Curated biomedical knowledge is becoming more valuable when paired with generative biology infrastructure. QIAGEN and NVIDIA agreed in May 2026 to connect BioNeMo with curated knowledge graphs for disease, target, and biomarker research. This pairing strengthens suppliers that combine proprietary evidence with scalable model development environments.
Semantic enrichment tools are gaining strategic importance as generative AI increases entity-resolution and provenance requirements. Causaly expanded agentic discovery in March 2025 across 500 million facts and 70 million directional relationships. Ontology depth and evidence traceability will increasingly shape enterprise selection and implementation costs.
Enterprise Deployments and Partnerships Converting Evidence Graphs into Recurring Revenue
Long-term enterprise agreements are validating knowledge graphs as core preclinical infrastructure rather than isolated experiments. BenchSci renewed its ASCEND agreement with Merck for two years in December 2025. Renewals strengthen recurring revenue visibility and create defensible workflow integration advantages.
Global deployments are expanding platform reach across distributed pharmaceutical research organizations. Sanofi signed a three-year ASCEND agreement in October 2025 covering its global preclinical research organization. Vendors with enterprise governance, training, and integration capacity can convert pilots into broader multi-site contracts.
Specialized partnerships and funding are opening application-specific entry points beyond discovery research. Graph AI raised USD 3 million in October 2025 to expand its AI-native pharmacovigilance and drug-safety platform. Focused providers can compete by solving regulated workflows that general graph platforms address less directly.
Your Business is Unique – Why Shouldn't Your Report Be?
Market Access Considerations
Curated Biomedical Evidence and Provenance
Curated biomedical evidence and provenance determine whether a vendor can enter regulated pharmaceutical workflows. Platforms must connect literature, patents, omics, clinical trials, internal experiments, safety records, and pipeline data without losing source context. This requirement raises data-licensing, curation, and validation costs before commercialization. QIAGEN Digital Insights, Clarivate, Causaly, BenchSci, and Data4Cure gain positioning from curated knowledge products and evidence-backed reasoning. Infrastructure-only providers often need specialist partners to meet pharmaceutical evidence requirements. These costs slow market entry significantly.
Ontology Alignment and Semantic Interoperability
Ontology alignment and semantic interoperability shape implementation speed across research organizations. RDF triple stores hold 38.0% share in 2026 because linked-data standards and pharmaceutical ontologies support cross-database reasoning. New entrants must handle entity extraction, terminology mapping, provenance, and changing scientific classifications. Strong pharmaceutical ontology management software reduces integration delays and supports reusable workflows. Weak semantic coverage creates expensive customization, limiting scale and weakening bids for enterprise deployments. It also increases dependence on customer-specific consulting resources.
Cloud Governance and Enterprise Integration
Cloud governance and enterprise integration determine how quickly platforms expand beyond pilot projects. Cloud holds 56.0% share in 2026 because managed services support frequent updates, elastic analytics, and distributed research teams. Buyers still require controlled access, internal-data connectivity, and traceable outputs across discovery, safety, regulatory, and medical functions. Microsoft Discovery, NVIDIA BioNeMo, AWS infrastructure, and Oracle graph capabilities raise buyer expectations for secure integration. Smaller vendors must partner or specialize. This raises entry costs materially.
How Stakeholders Benefit from the Key Focus Areas of Our Pharmaceutical Knowledge Graph Market Report
Explainable AI and connected biomedical evidence make this market commercially urgent across discovery, safety, regulatory, and portfolio workflows. The report links 16.6% overall growth with segment adoption, competitive positioning, funding signals, and implementation barriers. These findings support strategy, investment, partnership, and technology decisions.
- Unmet Needs and Market Gaps in Pharmaceutical Knowledge Graph Market: The report identifies where fragmented ontologies, weak entity resolution, limited provenance, and isolated internal datasets continue to block adoption. Product and research leaders can compare these gaps against faster-growing semantic enrichment, real-world data, and pharmacovigilance applications. This evidence supports build, partner, or acquisition decisions for underserved workflows. It also helps prioritize features that reduce implementation time and scientific validation costs.
- Funding and Venture Investment Opportunities in Pharmaceutical Knowledge Graph Market: Funding analysis separates broad platform opportunities from application-specific investment cases. Graph AI raised USD 3 million in October 2025 to expand knowledge-graph-based pharmacovigilance and drug-safety capabilities. Investment teams can compare funding signals with segment growth and deployment evidence. This supports decisions on specialist vendors, platform consolidation, and regulated workflow opportunities.
- Technology Innovation and Adoption Trends: The technology analysis tracks cloud platforms, RDF triple stores, labeled property graphs, multimodel architectures, GraphRAG, ontologies, and agentic workflows. Data and technology executives can see which architectures gain share and which retain installed-base advantages. The comparison supports infrastructure roadmaps, integration priorities, and vendor selection. It also highlights where curated data or domain expertise matters more than database performance.
- Pharmaceutical Knowledge Graph Market Competitive Landscape and Industry Analysis: The competitive landscape distinguishes infrastructure providers, pharmaceutical intelligence platforms, semantic integration specialists, and emerging application vendors. Corporate planners can benchmark tier position, platform breadth, commercial deployments, and pharmaceutical specialization across the named company set. This structure supports partner screening, competitor monitoring, and market-entry choices. It also reveals where established vendors hold procurement advantages and where specialists can differentiate.
- Mapping Strategic Partnerships and Ecosystem Synergies: Partnership mapping shows how graph infrastructure, curated biomedical evidence, scientific computing, laboratory systems, and pharmaceutical data combine within commercial solutions. Business development teams can assess Causaly and Microsoft, QIAGEN and NVIDIA, Data4Cure and Pfizer, plus BenchSci and Thermo Fisher Scientific. These relationships reveal capability gaps that alliances can close. The analysis supports partnership targets, integration priorities, and ecosystem positioning.
- Pharmaceutical Knowledge Graph Market CAGR and Growth Trends: Growth analysis compares the 16.6% market CAGR with faster segments, including Asia-Pacific at 19.6% and cloud deployment at 17.9%. Strategy and investment committees can identify where share shifts create the strongest expansion opportunities. The forecast supports regional allocation, product sequencing, sales planning, and long-term capacity decisions. It also clarifies which mature segments may grow strongly while losing relative share.
Pharmaceutical Knowledge Graph Market: Scope of the Report
| Key Report Attributes | Details | |
| Forecast Period | Till 2040 | |
| Market Size 2026 | USD 0.58 Billion | |
| Market Size 2040 | USD 5.00 Billion | |
| CAGR (Till 2040) | 16.6% | |
| Segments Covered |
|
|
| Geographical Regions Covered |
|
|
| Key Sections Covered |
|
|
Market Segmentation
The pharmaceutical knowledge graph market report presents an in-depth analysis, highlighting the capabilities of various stakeholders, based on different segments, such as offering, graph model, deployment, application, data source, end user, geographical regions, and leading players.
By Offering
- Knowledge Graph Platforms
- Graph Database Engines
- Semantic Enrichment and Ontology-Management Tools
- Curated Biomedical Knowledge Products
- Knowledge Graph Integration and Implementation Services
- Managed, Maintenance and Support Services
By Graph Model
- Resource Description Framework Triple Stores
- Labeled Property Graphs
- Hybrid and Multimodel Knowledge Graphs
By Deployment
- Cloud
- On-premises
- Hybrid
By Application
- Target Identification and Validation
- Biomarker Discovery and Precision Medicine
- Drug Repurposing and Indication Expansion
- Preclinical and Translational Research
- Clinical Trial Intelligence and Design
- Pharmacovigilance and Drug Safety
- Regulatory and Medical Intelligence
- Competitive and Portfolio Intelligence
By Data Source
- Scientific Literature and Patents
- Omics and Molecular Datasets
- Clinical Trial Data
- Real-World and Electronic Health Record Data
- Internal Experimental and Laboratory Data
- Drug Safety and Regulatory Data
- Commercial and Pipeline Data
By End User
- Pharmaceutical Companies
- Biotechnology Companies
- Contract Research Organizations
- Academic and Research Institutes
- Healthcare Providers
- Government and Regulatory Agencies
By Geographical Regions
- North America
- US
- Canada
- Mexico
- Rest of North America
- Europe
- Austria
- Belgium
- Denmark
- France
- Germany
- Ireland
- Italy
- Netherlands
- Norway
- Russia
- Spain
- Sweden
- Switzerland
- UK
- Rest of Europe
- Asia-Pacific
- China
- India
- Japan
- Singapore
- South Korea
- Rest of Asia-Pacific
- Latin America
- Argentina
- Brazil
- Chile
- Colombia
- Venezuela
- Rest of Latin America
- Middle East and Africa (MEA)
- Egypt
- Iran
- Iraq
- Israel
- Kuwait
- Saudi Arabia
- UAE
- Rest of MEA
- Rest of the World


