


 Download Free Sample
 Buy Now
Market Size
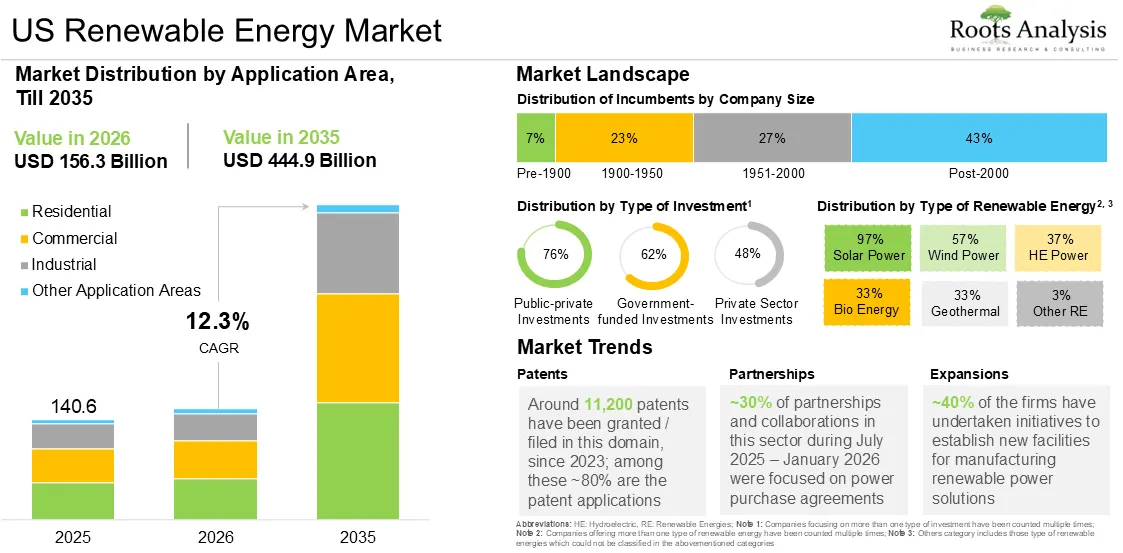
The US renewable energy market, valued at USD 140.6 billion in 2025, is projected to reach USD 156.3 billion in 2026 and USD 444.9 billion by 2035, representing a CAGR of 12.3% during the forecast period 2026 to 2035.
See What’s in the Full Report – Request Your Complimentary Insights!
Market Report: Key Takeaways
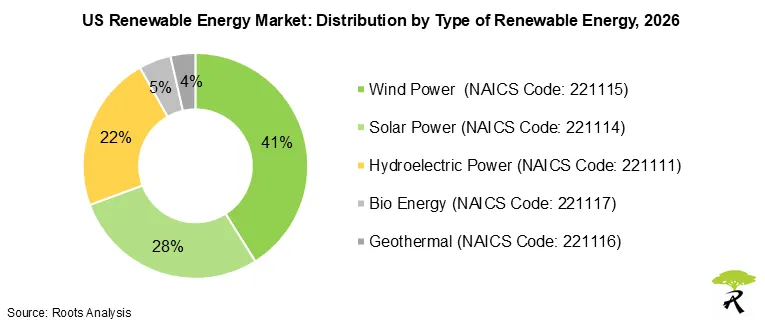
- In 2026, the US renewable energy market is dominated by wind power (capturing 41% share of US market), followed by solar energy (capturing 28% share of US market) and hydroelectric power (capturing 22% share of US market).
- In terms of type of organization, regional transmission organizations (RTO) dominate the overall market, accounting for a 22.8% share of the overall market in 2026.
- In 2026, the Midcontinent ISO (MISO) segment captures the largest US renewable energy market share (28.8%), based on the distribution by type of independent system operator, followed by Electric Reliability Council of Texas (ERCOT) and California ISO (CAISO).
- Private sector investments segment dominates the US renewable energy market based on the distribution by type of investment, capturing 48.7% of total revenue in 2026.
- In terms of US states, Texas dominates the overall market, accounting for 21.8% of overall revenue in 2026.
- Since 2023, the filing of nearly 11,200 patents signals a definitive shift from commoditization to technological differentiation. For US stakeholders, this R&D surge underscores a critical competitive imperative, as market leadership will now be determined by intellectual property moats in emerging tech, rather than just deployment scale.
- A comprehensive United States renewable energy market analysis reveals that 70% of agreements are intracontinental. This trend validates that the market is actively shortening supply chains to align with US onshoring mandates and reduce geopolitical exposure. Concurrently, the reliance on Power Purchase Agreements (30% of deals) confirms that securing long-term, fixed-rate buyers is currently the primary method for offsetting market volatility.
- The industry is entering an aggressive capitalization phase, as ~70% of infrastructure initiatives are directed toward establishing new facilities or expanding existing ones. This data indicates a maturing domestic supply base, encouraging US investors to pivot capital allocation from pure asset development to upstream manufacturing capabilities.
Market Overview
According to the World Economic Forum and IRENA reports, renewable energy capacity worldwide surged by a remarkable 15.1% in 2024, reaching an installed base of approximately 4,448 GW. This global momentum has established a robust foundation for the US renewable energy market, which is currently navigating a critical phase of recalibration and resilient growth.
The surge in the US renewable energy market size is driven notably by the widespread adoption of solar energy investment opportunities, with the US recording an impressive 28% year-over-year increase in solar power generation till March 2025, far surpassing earlier estimates. Further, offshore wind pipeline and farm development is gaining momentum and demonstrating strategic resilience. Despite navigating complex regulatory headwinds in late 2025, the long-term project pipeline continues to capitalize on consistent coastal wind patterns to reinforce these emerging trends in renewable energy.
Technological convergence is further accelerating these market dynamics, as renewable energy technology advancements shift focus from pure generation volume to grid intelligence and efficiency. The commercialization of perovskite solar cells is enhancing module efficiency to lower the levelized cost of electricity (LCOE), while the integration of artificial intelligence (AI) and IoT remains critical for stabilizing the variable output of the expanding wind and smart solar energy. As these innovations mature, the US renewable energy market outlook projects sustained expansion through 2035, characterized by a transition from policy-dependent growth to a demand-driven ecosystem anchored by energy security, domestic manufacturing, and robust green energy investment opportunities.
Recent Industry Developments
- In September 2025, AES announced the expansion of its renewable energy generation by expanding solar, wind and battery storage capacity to achieve its long-term clean energy targets.
- In January 2026, Constellation acquired Calpine from Energy Capital Partners (ECP). The organization aims to deliver reliable, clean power by uniting former company’s zero-emission nuclear fleet with latter company’s industry-leading natural gas and geothermal generation.
- In December 2025, LS Power acquired bp’s US Onshore Wind Business. The acquisition adds ~1,300 MW net ownership of operating onshore wind capacity across 10 projects to LS Power’s diversified portfolio of renewable, energy storage, flexible natural gas, and renewable fuels assets.
- In January 2026, Ormat Technologies announced a USD 25 million equity investment in an over USD 97 million Series B funding round for Sage Geosystems. This funding supports Sage Geosystems in advancing its geothermal power generation and energy storage solutions, including the development of its first commercial next-generation geothermal facility.
Unlock Deeper Insights – Schedule Your Personalized Workshop Today!
Market Share Insights
Wind Power Dominates the Current Market While Solar Energy to Drive Growth Through 2035
According to the US renewable energy industry report, wind power sub-segment dominates the market, accounting for 41% of the market share in 2026. This dominance stems from the offshore wind development pipeline and increasing electricity demand which has created more opportunities for companies involved in generating wind power.
Meanwhile, within the US renewable energy market, the solar power sub-segment is likely to grow at a high CAGR of 12.9%. Continuous manufacturing improvements and economies of scale which have made solar installations significantly cheaper for residential, commercial and utility-scale projects drive this growth in modern architecture.
Market Share by Application Area: Residential Applications Hold Lucrative Market Share
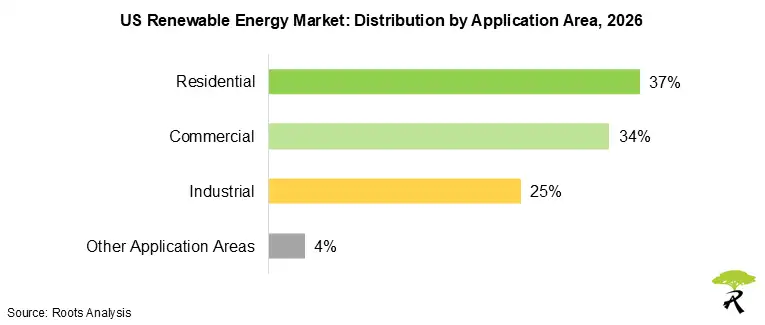
US renewable energy industry market forecast estimates indicate that the residential sub-segment holds the maximum market share (37%) in 2026. This is due to the decline in hardware and installation costs that has significantly lowered the upfront investment required for rooftop solar and small-scale wind, improving payback periods and making projects financially viable for middle-income households.
Texas Leads US Renewable Energy Market
Texas leads the US renewable energy market size by capturing maximum (21.1%) share in 2026 and is anticipated to grow at a CAGR of 11. 2% through 2035. The US state-level renewable energy market analysis indicates that this dominance is due to rapid urbanization, industrialization and surging energy demand in the state. Further, government initiatives for smart infrastructure and renewable integration accelerate adoption of renewables in this state amid carbon neutrality goals.
Want Information on Specific Region / Segment?
Market Dynamics
Competitive Landscape of US Renewable Energy Developers
Incumbent companies and emerging startups actively shape the US renewable energy market's competitive landscape through specialized industry solutions. Notably, amongst the incumbent companies, the current market is dominated by very large companies; examples (in alphabetical order) include AES, Chevron, Constellation and Duke Energy. Additionally, around 35% of the renewable energy startups are headquartered in Texas and California, reflecting the mature innovation ecosystem and strong policy support for resilient, renewable energy technologies in these states.
US renewable energy startups have raised significant investments through different types of models, in order to produce clean energy through various sources like geothermal, solar and wind power. Interestingly, around 90% of investments have been raised through private sector, indicating a strong market confidence in the commercial viability of renewable technologies and reduced dependence on federal subsidies. Further, this indicates the sector's maturation in attracting venture capital and private equity investments.
Regulatory Scenario of US Renewable Energy Sector
The regulatory frameworks established for renewables vary across various US states, upholding a common goal of ensuring energy resilience, by prioritizing sustainable sources of energy, such as solar, wind, and biobatteries storage, and reducing dependency on fossil fuels. Many states have implemented Renewable Portfolio Standards (RPS) or Clean Energy Standards (CES), mandating that utilities procure increasing shares (around 15-50%) of electricity from renewable or clean sources. These policies, supported by state-specific incentives, permitting reforms, and executive actions in progressive states, have driven substantial deployment and investment in renewables.
On the contrary, these diverse state-level frameworks can also function as regulatory barriers in US renewable energy sector that impede project deployment and deter investments in the domain. Variations in zoning ordinances, permitting processes and interconnection standards often create inconsistencies with local jurisdictions in numerous counties imposing restrictions. Examples of regulatory barriers are as follows:
- The One Big Beautiful Bill Act (OBBBA) of 2025: This act has curtailed key incentives from the Inflation Reduction Act by shortening qualification periods for wind and solar tax credits, mandating continuous construction.
- Permitting and National Environmental Policy Act (NEPA) Delays: The permitting process for clean energy infrastructure, governed by statutes like the National Environmental Policy Act (NEPA), can extend timelines by months or years due to extensive environmental reviews, interagency coordination challenges, and the potential for litigation from stakeholders.
Key Market Drivers
- Rising Corporate Demand for Clean and Reliable Power: Large industrial and commercial consumers are under growing pressure from investors, customers, and ESG disclosure norms to decarbonize their operations. This is driving a surge in corporate renewable Power Purchase Agreements (PPAs), green tariffs, and behind-the-meter solutions.
- Declining Levelized Cost of Energy (LCOE) Trends: The significant reduction in renewable energy costs is accelerating market adoption and expanding renewable energy investment opportunities worldwide. In 2024, 91% of new renewable projects were cheaper than fossil fuels, with solar PV costs declining 41% and onshore wind costs falling 53% compared to conventional energy sources.
- Increasing Government Support: Government organizations are increasingly recognizing the need to promote low-emission power via renewable sources like solar and wind, thereby providing several incentives for the development of novel solution systems. This helps in enhancing energy efficiency and sustainability across commercial, industrial, and utility sectors.
Market Challenges
- Supply Chain Volatility and Input Cost Fluctuations: Global supply chain dynamics expose the renewable sector to risks for key components such as modules, turbines, inverters, and batteries. Disruptions in logistics and shifts in trade policies can lead to price volatility and procurement delays. Managing these uncertainties remains a critical challenge for project execution.
- Energy Storage Limitations: Elevated costs and performance limitations of battery storage systems restrict their ability to manage intermittency from renewable sources, thereby compromising power reliability and scalability. This challenge undermines consistent energy supply in off-grid or hybrid configurations, wherein insufficient storage capacity leads to frequent outages.
- Land Acquisition, Permitting and Social Acceptance Risks: Securing suitable land and obtaining all necessary environmental and regulatory clearances can be complex and time-consuming. Competing land uses, concerns over biodiversity and local community resistance may lead to project redesigns or legal challenges.
Pay Only for What You Need – The Best Way to Optimize
US Renewable Energy Market: Scope of the Report
| Key Report Attributes | Details | |
| Historical Trend | Since 2021 | |
| Forecast Period | Till 2035 | |
| Market Size 2026 | USD 156.3 Billion | |
| Market Size 2035 | USD 444.9 Billion | |
| CAGR (Till 2035) | 12.3% | |
| Segments Covered |
|
|
| Key Players Profiled |
|
|
Market Segmentation
Based on the research, we have segmented the US renewable energy market into type of renewable energy, type of organization, type of independent system operators, application area, type of investment and US states.
Market Share by Type of Renewable Energy
- Wind Power (NAICS Code: 221115)
- Solar Power (NAICS Code: 221114)
- Hydroelectric Power (NAICS Code: 221111)
- Bio Energy (NAICS Code: 221117)
- Geothermal (NAICS Code: 221116)
Market Share by Type of Organization
- Independent System Operators
- Regional Transmission Organizations
- Independent System Operators / Regional Transmission Organizations
- Non-Regional Transmission Organizations
Market Share by Type of Independent System Operators
- Midcontinent ISO
- Electric Reliability Council of Texas
- California ISO
- Pennsylvania Jersey Maryland
- Southwest Power Pool
- New York ISO
- New England ISO
Market Share by Application Area
- Residential
- Commercial
- Building Energy Service
- Data Centers and IT Services
- Education and Institutes
- Healthcare Facilities
- Other Applications
- Industrial
- Manufacturing
- Construction
- Mining
- Agriculture
- Other Application Areas
Market Share by Type of Investment
- Private Sector Investments
- Government-funded Investments
- Public-private Investments
Market Share by US States
- Texas
- California
- Iowa
- Oklahoma
- Illinois
- Kansas
- Florida
- Colorado
- New Mexico
- Minnesota
- Arizona
- Nevada
- Indiana
- Georgia
- North Dakota
- North Carolina
- Michigan
- New York
- South Dakota
- Oregon
- Virginia
- Nebraska
- Wyoming
- Ohio
- Washington
- Missouri
- Wisconsin
- Utah
- Pennsylvania
- Montana
- Maine
- Arkansas
- Idaho
- South Carolina
- Alabama
- Mississippi
- Louisiana
- Massachusetts
- New Jersey
- West Virginia
- Maryland
- Hawaii
- Tennessee
- Kentucky
- New Hampshire
- Connecticut
- Rhode Island
- Vermont
- Delaware
- Alaska


