Climate Tech Market by Technology Domain, End-Use Sector (Electricity and Utilities, Manufacturing and Heavy Industry, Transportation and Mobility, Buildings and Construction, Agriculture and Food Systems, and Waste and Resource Management), Offering Type, Climate Function, Customer Type, Geographical Regions, and Leading Players - Trends and Forecasts, 2026-2040
Market Size
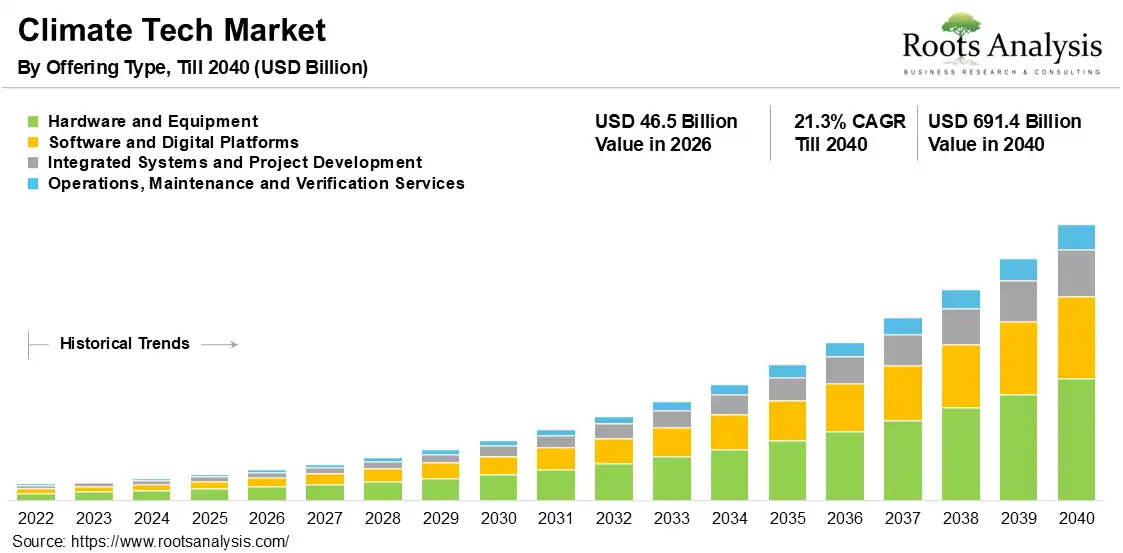
The global climate tech market is expected to rise from USD 46.5 billion in 2026 and is projected to reach USD 691.4 billion by 2040, growing at a CAGR of 21.3% over the forecast period 2026 to 2040, driven by electrification and industrial decarbonization.
See What’s in the Full Report – Request Your Complimentary Insights!
Market Report: Key Takeaways
- Based on technology domain, renewable power generation captures 34.0% market share in 2026, whereas carbon removal and sequestration register a 27.4% CAGR through 2040, supported by expanding corporate offtake commitments.
- Based on end-use sector, electricity and utilities capture 31.0% market share in 2026, whereas manufacturing and heavy industry register a 23.4% CAGR through 2040, driven by industrial decarbonization mandates.
- Based on offering type, hardware and equipment capture 47.0% market share in 2026, whereas software and digital platforms register a 24.1% CAGR through 2040, supported by automated emissions management.
- Based on climate function, emissions avoidance and reduction capture 46.0% market share in 2026, whereas carbon removal and sequestration register a 27.4% CAGR through 2040, driven by durable removal procurement.
- Based on geography, North America captures 36.5% market share in 2026, whereas Asia-Pacific registers a 23.7% CAGR through 2040, supported by localized manufacturing and infrastructure investment.
Climate Tech Market Outlook
Climate technology demand is shifting from standalone renewable assets toward integrated systems spanning storage, grids, industrial heat, carbon footprint management, and emissions software. The climate tech market size now reflects broader spending across hardware, project development, digital platforms, and verification services. Renewable power still holds 34.0% of 2026 demand. Its share falls by 2040 as carbon removal, long-duration storage, and industrial decarbonization expand faster across multiple industries.
Current growth comes from electrification, grid modernization, corporate procurement, and policy-backed infrastructure financing. Germany’s government planned EUR 13.3 billion in 2027 energy-cost relief during July 2026, including grid-fee subsidies and industrial electricity support. Brookfield and Google also signed a United States hydroelectric framework covering up to 3,000 megawatts in July 2025. Together, public support and long-term procurement improve project bankability across power markets.
Through 2040, the market will remain high-growth, although renewable hardware expansion will gradually moderate. Software platforms, carbon capture and removal, hydrogen systems, and manufacturing decarbonization will gain share as buyers seek measurable operational outcomes. Stegra closed EUR 1.4 billion in financing during June 2026. The funding supports its hydrogen-fuelled low-emission steel facility in northern Sweden. Competitive advantage will increasingly depend on bankable deployment, manufacturing scale, and verified emissions performance.
Climate Tech Market Dynamics
Climate Tech Market Drivers
Electrification and grid modernization create the strongest expansion engine behind the climate tech market size. Electricity and utilities hold 31.0% of 2026 demand, while hardware and equipment capture 47.0%. Renewable generation, transmission upgrades, and storage integration require coordinated capital spending. Brookfield and Google signed a United States hydroelectric framework covering up to 3,000 megawatts in July 2025. This procurement model supports bankable clean energy technologies at infrastructure scale.
Climate Tech Market Restraints
Capital intensity restrains deployment across batteries, electrolysers, capture units, grid equipment, and industrial systems. Hardware remains the largest offering because buyers must fund manufacturing, installation, certification, and network connection before generating operating returns. First-of-kind projects also face long construction cycles and uncertain utilization. These conditions favor companies with strong balance sheets, proven performance, and access to long-term capital. Smaller developers face slower commercialization and greater partnership dependence.
Climate Tech Market Opportunities
Carbon removal, climate software, and industrial decarbonization create the clearest expansion opportunities. Carbon removal and sequestration will grow at 27.4% CAGR through 2040, while software and digital platforms will expand at 24.1%. Frontier added USD 915 million in advance carbon-removal purchase commitments during June 2026, lifting total commitments to approximately USD 1.8 billion. Larger commitments improve project bankability and attract specialized technology providers.
Climate Tech Market Challenges
Commercial scaling remains difficult when climate technologies move from demonstration to repeatable manufacturing. Developers must secure customer offtake, project finance, qualified suppliers, permits, and credible measurement systems before large deployments proceed. Climactic launched Material Scale in February 2026 as a hybrid debt-and-equity vehicle for climate-materials companies entering commercial production. The need for specialized financing shows why technical performance alone does not guarantee competitive scale.
Climate Tech Market Size Estimation Methodology
- As a starting point, the analysis set a boundary covering renewable power, storage, electrification, hydrogen, carbon management, climate software, and circular systems. It mapped every estimate to common technology, end-use, offering, climate function, customer, and regional categories. Narrow studies covering only one technology were excluded from the headline consensus. This preserved comparability across capital-intensive infrastructure and digital services.
- Moving forward, multiple credible secondary sources were normalized to a common 2026 reference year and 2040 forecast horizon. Reported base years, forecast periods, and compound growth rates were recalculated using consistent annual compounding. This step removed timing distortions and created a comparable foundation for the climate tech market size assessment. Currency bases were aligned before interpolation and extrapolation.
- Building on this, the top-down estimates were cross-checked against technology-specific operating indicators. The review considered renewable installations, battery shipments, grid equipment demand, electrolyser capacity, carbon capture pipelines, and climate software adoption. Trade flow data and critical-materials production volumes tested whether projected hardware expansion matched supply-chain capacity. Utility billing data provided an additional demand-side check.
- Drawing upon these, segment shares were assigned using installed deployment, capital intensity, procurement scale, and commercialization maturity. Utility investment data supported electricity and grid estimates, while construction cost indices informed capital-heavy project assumptions. Corporate purchase commitments, verified removal volumes, and emissions reporting demand supported carbon removal and software growth rates. Patent filing volumes indicated where innovation pipelines were widening.
- The projected value was then, as a validation step, distributed across technology domains and end-use sectors. Each segment received a distinct growth curve based on maturity, policy exposure, manufacturing scalability, and customer adoption. Share gains for storage, carbon management, software, and industrial systems were balanced against moderating renewable hardware growth. The method also prevented double counting between hardware, integrated projects, and services.
- Finally, the forecast was tested through conservative, base, and accelerated adoption cases. Sensitivity checks examined financing availability, grid access, equipment costs, project delays, policy continuity, and commercialization timing. Regional totals and segment totals were reconciled to 100%, while the annual curve was reviewed for unrealistic jumps. The final 21.3% CAGR reflects the normalized base case rather than any single source.
Climate Tech Market Share Insights
Market Share by Offering Type
According to our analysis, hardware leads because generation equipment, batteries, grid components, electrolysers, capture units, and industrial systems require substantial capital. Manufacturing scale and certified performance remain important purchasing criteria for infrastructure owners.
Software will grow fastest as organizations automate emissions accounting, asset optimization, climate-risk analysis, and regulatory reporting. Artificial intelligence will reduce manual workloads and connect sustainability data with operational decisions.
Market Share by Customer Type
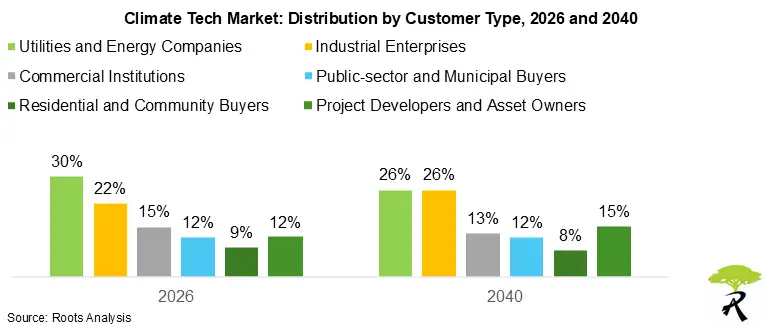
Utilities and energy companies lead through large capital budgets, regulated asset ownership, and established procurement capabilities. They purchase generation, storage, grid software, transmission equipment, and supporting services at scale.
Project developers and asset owners will expand fastest as climate infrastructure moves toward integrated, multi-technology portfolios. Access to long-term capital and development expertise will support platform consolidation.
Want Information on Specific Region / Segment?
Regional Analysis: North America Leads the Market and Asia-Pacific is Likely to Register Higher CAGR
Presently, North America holds 36.5% market share in 2026. North America leads through deep venture capital markets, corporate procurement, infrastructure developers, and established clean-energy supply chains. Federal, state, provincial, and utility programs support renewable power, storage, electrification, carbon management, and climate software. Brookfield and Google signed a United States hydroelectric framework covering up to 3,000 megawatts in July 2025.
On the contrary, Asia-Pacific grows at a 23.7% CAGR from 2026 to 2040. Asia-Pacific will grow fastest through manufacturing localization, rising electricity demand, urbanization, and large grid-modernization programs. Battery, renewable, mobility, and industrial technology supply chains will strengthen regional deployment economics. GE Vernova announced a USD 16 million Indian grid-technology manufacturing expansion in May 2025.
Market Ecosystem Analysis
Within this qualitative set, 10 Tier 1 leaders represent most large-scale activity, alongside nine specialists and six emerging entrants. Selective vertical integration and hardware-software bundling dominate, particularly across grids, storage, and industrial decarbonization. AI-driven load growth now intensifies competition for transformers, storage capacity, interconnections, and firm power across major markets. Advantage is shifting toward vendors controlling localized supply, bankable deployments, digital optimization, and contracted demand.
- In February 2025, Tesla started Megapack production at its Shanghai megafactory, adding export-oriented capacity near Asian suppliers. In June 2025, Tesla signed a $556.8 million Shanghai grid-storage project using Megapacks. These moves pressure independent integrators while strengthening Tesla across Asia-Pacific manufacturing, utility storage, and project deployment.
- In May 2025, CATL launched the mass-producible 9 MWh TENER Stack, emphasizing density, safety, transportability, and deployment flexibility. The product raises container-level performance benchmarks for battery suppliers and system integrators across global utility-scale storage.
- In November 2025, Fluence and LEAG announced a 1 GW, 4 GWh German project using Fluence Smartstack. The project raises bankability and execution barriers for specialists, strengthening European integrated storage systems and project development.
- In October 2025, GE Vernova agreed to purchase Prolec GE’s remaining half for $5.28 billion. Full ownership tightens transformer supply integration and pressures competitors lacking localized North American manufacturing. The transaction strengthens grid infrastructure serving utilities, data centers, renewable projects, and industrial electrification.
- In May 2025, ABB launched BESS-as-a-Service, combining equipment, software, maintenance, optimization, and energy-market participation. The zero-upfront-cost model lowers adoption barriers and pressures standalone vendors serving commercial and industrial storage customers.
- In June 2025, Schneider Electric launched prefabricated AI data-center systems with liquid cooling, high-power busways, and integrated racks. The bundle raises full-stack requirements, strengthening Schneider across building efficiency, electrification, and high-density commercial infrastructure.
- In September 2025, Schneider Electric contracted Climeworks for 31,000 tons of high-durability carbon removal through 2039. The agreement strengthens direct air capture, bioenergy capture, enhanced weathering, and verification within corporate net-zero portfolios. It pressures smaller suppliers to demonstrate durability, delivery capacity, and credible measurement.
- In June 2026, Bloom Energy and Brookfield expanded their AI-infrastructure power partnership to $25 billion. The framework lowers financing barriers for fuel-cell deployments and pressures smaller behind-the-meter power providers. It strengthens distributed firm power for data centers needing faster delivery than conventional grid expansion.
Startup Companies and their Key Highlights
- Fervo Energy
- Event type and funding amount: $462 million Series E.
- Month and year: December 2025.
- Lead investor: B Capital.
- Stated purpose: Advance Cape Station and scale round-the-clock carbon-free geothermal power.
- Market implication: Accelerates North American enhanced geothermal capacity and improves firm-power bankability for utilities and data centers.
- Commonwealth Fusion Systems
- Event type and funding amount: $863 million Series B2.
- Month and year: August 2025.
- Stated purpose: Complete SPARC development and advance the company’s first ARC commercial fusion facility in Virginia.
- Market implication: Accelerates fusion engineering and commercial-site preparation within North America’s emerging firm-power segment.
- Heirloom Carbon Technologies
- Event type: Strategic investment and purchase rights covering 500,000 tons of captured carbon dioxide.
- Month and year: February 2025.
- Strategic partner: United Airlines Ventures Sustainable Flight Fund.
- Stated purpose: Scale direct air capture and support permanent sequestration or lower-carbon aviation fuel production.
- Market implication: Expands aviation-linked demand for direct air capture and strengthens United States carbon-removal commercialization.
- EnerVenue
- Event type and funding amount: $300 million Series B extension.
- Month and year: April 2026.
- Lead investor: Full Vision Capital.
- Stated purpose: Expand high-volume nickel-hydrogen battery manufacturing facilities in Changzhou, China.
- Market implication: Accelerates Asia-Pacific manufacturing and diversifies battery technologies for stationary and long-duration energy-storage systems.
- Stegra
- Event type and funding amount: €1.4 billion financing round.
- Month and year: June 2026.
- Lead investor: A consortium led by Wallenberg Investments.
- Stated purpose: Complete construction of Stegra’s hydrogen-based green-steel facility in Boden, Sweden.
- Market implication: Supports European near-zero-emission steel capacity and strengthens hydrogen use within heavy-industry decarbonization.
- Form Energy
- Event type: First commercial deployment of the company’s 100-hour iron-air battery systems.
- Month and year: October 2025.
- Strategic partner: Great River Energy.
- Stated purpose: Install multi-day energy storage for Great River Energy’s Minnesota electricity system.
- Market implication: Validates commercial iron-air manufacturing and reduces technology risk within utility-scale multi-day storage.
Climate Tech Market Trends / Opportunities
Long-Duration Storage Scaling Reshapes Climate Tech Market Manufacturing Competition
Stationary storage competition is expanding beyond conventional short-duration systems toward technologies designed for longer operating cycles. EnerVenue announced USD 300 million in financing during April 2026 and planned high-volume nickel-hydrogen battery manufacturing in China. Manufacturing access and production scale will increasingly determine which storage developers secure utility and industrial projects.
Grid flexibility will gain market share as renewable penetration raises demand for dispatchable capacity and network balancing. The United Kingdom’s National Wealth Fund prioritized batteries, energy storage, and electricity grids in January 2026. It also targeted GBP 4 billion to GBP 5 billion in annual investment. Public capital will favor integrated platforms with proven delivery capabilities.
Carbon Removal Procurement Expands Climate Tech Market Bankability
Durable carbon-removal procurement is moving from pilot purchases toward larger, multi-year buyer portfolios. Frontier added USD 915 million in advance purchase commitments during June 2026, increasing total commitments to approximately USD 1.8 billion. Larger commitments improve revenue visibility, support project finance, and intensify competition among direct air capture, biomass storage, and mineralization providers.
Verified delivery volumes are becoming central to commercial differentiation across carbon capture and removal. Frontier agreed in December 2025 to pay USD 44.2 million for 122,000 metric tons of removal from NULIFE GreenTech’s biowaste-to-bio-oil process. Providers with credible measurement and permanent storage pathways will gain stronger buyer confidence.
Industrial Electrification and Green Steel Shift Capital Toward Integrated Decarbonization
Industrial electrification is creating new entry points for software-controlled heat and energy-efficiency systems. Eqon closed a USD 6 million seed round in June 2026. The funding supports electric-heating systems designed to replace fossil-fuel heat in industrial facilities. Lower installation complexity could help specialized suppliers compete against larger integrated equipment vendors.
Green steel is shifting industrial decarbonization from demonstration projects toward capital-intensive commercial facilities. Stegra closed EUR 1.4 billion in financing during June 2026 for its hydrogen-fueled low-emission steel plant in northern Sweden. Financing depth, customer commitments, and construction execution will separate scalable producers from technology developers.
Public Finance and Critical Materials Programs Reorder Regional Supply Chains
Sovereign investment programs are bundling batteries, critical minerals, low-carbon fuels, and circular systems into coordinated industrial strategies. Brazil’s fifth Eco Invest auction sought to mobilize approximately BRL 50 billion in May 2026 for sustainable technologies across these categories. Regional financing packages will attract developers able to build local supply chains and integrated projects.
Critical-material security is becoming a direct competitive factor for storage, electrification, and advanced manufacturing companies. The United States Department of Defense announced a USD 25 million investment in ReElement Technologies during July 2026. The investment expands recycling and rare-earth production equipment. Local processing capacity will strengthen suppliers that can reduce imported material exposure.
Your Business is Unique – Why Shouldn’t Your Report Be?
Market Access Considerations
Grid Interconnection and Regulated Cost Recovery
Grid access and regulated cost recovery determine whether power, storage, and electrification projects reach commercial operation. Utilities control interconnection, transmission upgrades, and network investment, which can delay otherwise bankable assets. Germany’s July 2026 energy-relief plan included grid-fee subsidies and industrial electricity support through its Climate and Transformation Fund. Suppliers that align equipment performance with utility procurement and tariff structures can scale faster than standalone technology vendors. This favors suppliers experienced in regulated infrastructure delivery and long procurement cycles.
Commercial-Scale Financing Availability
Commercial-scale climate infrastructure requires financing structures that match long construction periods and uncertain early utilization. Conventional venture funding often cannot cover manufacturing plants, project delivery, and customer ramp-up simultaneously. Climactic launched Material Scale in February 2026 as a hybrid debt-and-equity vehicle for climate-materials companies entering commercial production. Companies with blended capital, credible offtake, and phased deployment plans gain a stronger route to market. That financing mix reduces dilution and supports staged manufacturing expansion.
Critical-Material Localization and Supply Security
Critical-material availability shapes entry costs for batteries, grid equipment, magnets, and advanced industrial systems. Local processing capacity can reduce supply disruption, but it requires specialized equipment, environmental controls, and secure feedstock. The United States Department of Defense invested USD 25 million in ReElement Technologies during July 2026. The funding expands recycling and rare-earth production equipment. Suppliers with localized material access can offer customers stronger delivery certainty and policy alignment. It also improves eligibility for public incentives and strategic procurement.
How Stakeholders Benefit from the Key Focus Areas of Our Climate Tech Market Report
Electrification, industrial decarbonization, and grid modernization make climate technology commercially urgent across infrastructure and manufacturing. The market will expand at 21.3% CAGR through 2040, while growth shifts toward storage, software, carbon management, and integrated projects. This research connects segment economics, regional momentum, funding signals, and competitive capabilities to strategic, investment, and technology decisions.
- Unmet Needs and Market Gaps in Climate Tech Market: The report identifies unmet needs where deployment economics, verification requirements, or infrastructure constraints slow adoption. It highlights carbon removal, long-duration energy storage, industrial heat, and grid flexibility as areas with widening demand gaps. Corporate planners and product leaders can use this evidence to prioritize development budgets and select target customers. They can also decide whether internal capability or external partnerships offer the faster route.
- Funding and Venture Investment Opportunities in Climate Tech Market: The analysis compares financing needs across hardware manufacturing, project development, software platforms, and verified removal services. It separates venture-scale opportunities from infrastructure assets requiring debt, offtake commitments, or public capital. Investment committees and finance teams can use these distinctions to screen opportunities and structure capital stacks. They can also test whether commercialization timelines match portfolio return requirements.
- Technology Innovation and Adoption Trends: Technology adoption analysis tracks which solutions gain share as buyers demand measurable operating and emissions outcomes. Software and digital platforms will grow at 24.1% CAGR, while carbon removal and sequestration will expand at 27.4%. Engineering leaders and innovation teams can use these adoption curves to plan product roadmaps, integration priorities, and validation programs for faster-moving technologies.
- Climate Tech Market Competitive Landscape and Industry Analysis: The climate tech competitive landscape maps Tier 1 infrastructure leaders, specialized technology providers, and emerging developers across the value chain. Coverage spans Tesla, Siemens, GE Vernova, CarbonCure, Climeworks, Form Energy, Watershed, and other supplied companies. Corporate development teams can compare capability depth, commercialization maturity, and market role before selecting acquisition targets, partners, suppliers, or competitive benchmarks.
- Mapping Strategic Partnerships and Ecosystem Synergies: The ecosystem analysis shows where partnerships connect equipment, project finance, grid access, software, and measurement capabilities. It distinguishes opportunities involving utilities, industrial enterprises, project developers, carbon-removal buyers, and public-sector programs. Business development managers can use this map to identify complementary partners and shape joint offerings. They can also target relationships that reduce entry barriers or accelerate customer access.
- Climate Tech Market CAGR and Growth Trends: The report explains how the 21.3% overall CAGR separates into distinct segment and regional growth paths. Asia-Pacific leads regional expansion at 23.7%, while manufacturing and heavy industry grow at 23.4%. Strategy and operations leaders can use these comparisons to set geographic priorities and allocate sales capacity. They can also sequence market entry without overcommitting resources to mature or slower-share segments.
Climate Tech Market: Scope of the Report
| Key Report Attributes | Details | |
| Forecast Period | Till 2040 | |
| Market Size 2026 | USD 46.5 Billion | |
| Market Size 2040 | USD 691.4 Billion | |
| CAGR (Till 2040) | 21.3% | |
| Segments Covered |
|
|
| Geographical Regions Covered |
|
|
| Key Sections Covered |
|
|
Market Segmentation
The Climate Tech Market report presents an in-depth analysis, highlighting the capabilities of various stakeholders, based on different segments, such as technology domain, end-use sector, offering type, climate function, customer type, geographical regions, and leading players.
By Technology Domain
- Renewable Power Generation
- Energy Storage and Grid Flexibility
- Electrification And Energy Efficiency
- Low-Carbon Hydrogen and Fuels
- Carbon Capture, Utilization and Storage
- Carbon Removal and Sequestration
- Climate Intelligence and Emissions Software
- Circular Economy and Resource Recovery
By End-Use Sector
- Electricity and Utilities
- Manufacturing and Heavy Industry
- Transportation and Mobility
- Buildings and Construction
- Agriculture and Food Systems
- Waste and Resource Management
By Offering Type
- Hardware and Equipment
- Software and Digital Platforms
- Integrated Systems and Project Development
- Operations, Maintenance and Verification Services
By Climate Function
- Emissions Avoidance and Reduction
- Carbon Capture and Permanent Storage
- Carbon Removal and Sequestration
- Climate Adaptation and Resilience
- Measurement, Reporting and Verification
- Resource Efficiency and Circularity
By Customer Type
- Utilities And Energy Companies
- Industrial Enterprises
- Commercial Institutions
- Public-Sector and Municipal Buyers
- Residential and Community Buyers
By Geographical Regions
- North America
- US
- Canada
- Mexico
- Rest of North America
- Europe
- Austria
- Belgium
- Denmark
- France
- Germany
- Ireland
- Italy
- Netherlands
- Norway
- Russia
- Spain
- Sweden
- Switzerland
- UK
- Rest of Europe
- Asia-Pacific
- China
- India
- Japan
- Singapore
- South Korea
- Rest of Asia-Pacific
- Latin America
- Argentina
- Brazil
- Chile
- Colombia
- Venezuela
- Rest of Latin America
- Middle East and Africa (MEA)
- Egypt
- Iran
- Iraq
- Israel
- Kuwait
- Saudi Arabia
- UAE
- Rest of MEA
- Rest of the World


