


 Download Free Sample
 Buy Now
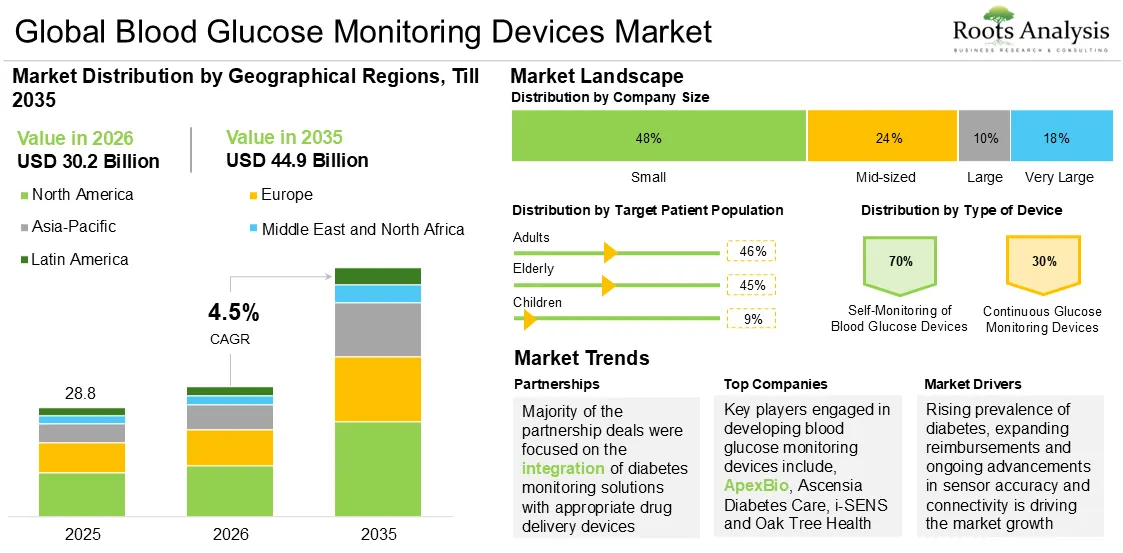
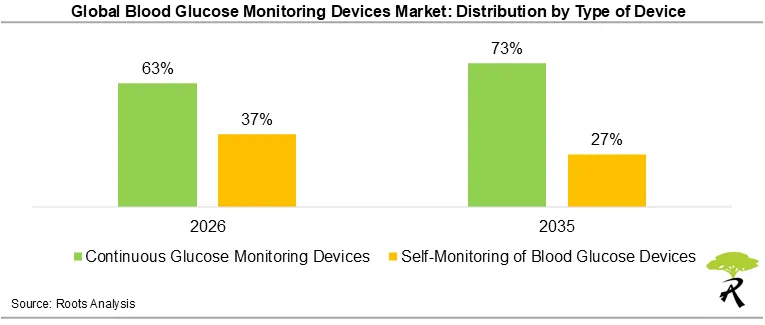
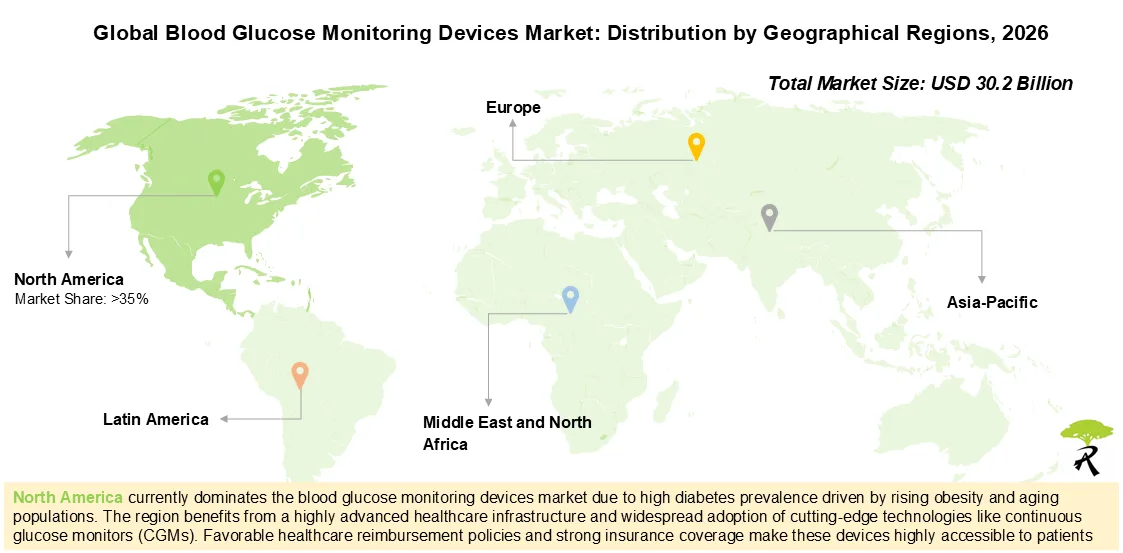
Table of Contents
1.1. Introduction
1.2. Market Share Insights
1.3. Key Market Insights
1.4. Report Coverage
1.5. Key Questions Answered
1.6. Chapter Outlines
2.1. Chapter Overview
2.2. Research Assumptions
2.2.1. Market Landscape and Market Trends
2.2.2. Market Forecast and Opportunity Analysis
2.2.3. Comparative Analysis
2.3. Database Building
2.3.1. Data Collection
2.3.2. Data Validation
2.3.3. Data Analysis
2.4. Project Methodology
2.4.1. Secondary Research
2.4.1.1. Annual Reports
2.4.1.2. Academic Research Papers
2.4.1.3. Company Websites
2.4.1.4. Investor Presentations
2.4.1.5. Regulatory Filings
2.4.1.6. White Papers
2.4.1.7. Industry Publications
2.4.1.8. Conferences and Seminars
2.4.1.9. Government Portals
2.4.1.10. Media and Press Releases
2.4.1.11. Newsletters
2.4.1.12. Industry Databases
2.4.1.13. Roots Proprietary Databases
2.4.1.14. Paid Databases and Sources
2.4.1.15. Social Media Portals
2.4.1.16. Other Secondary Sources
2.4.2. Primary Research
2.4.2.1. Types of Primary Research
2.4.2.1.1. Qualitative Research
2.4.2.1.2. Quantitative Research
2.4.2.1.3. Hybrid Approach
2.4.2.2. Advantages of Primary Research
2.4.2.3. Techniques for Primary Research
2.4.2.3.1. Interviews
2.4.2.3.2. Surveys
2.4.2.3.3. Focus Groups
2.4.2.3.4. Observational Research
2.4.2.3.5. Social Media Interactions
2.4.2.4. Key Opinion Leaders Considered in Primary Research
2.4.2.4.1. Company Executives (CXOs)
2.4.2.4.2. Board of Directors
2.4.2.4.3. Company Presidents and Vice Presidents
2.4.2.4.4. Research and Development Heads
2.4.2.4.5. Technical Experts
2.4.2.4.6. Subject Matter Experts
2.4.2.4.7. Scientists
2.4.2.4.8. Doctors and Other Healthcare Providers
2.4.2.5. Ethics and Integrity
2.4.2.5.1. Research Ethics
2.4.2.5.2. Data Integrity
2.4.3. Analytical Tools and Databases
2.5. Robust Quality Control
3.1. Chapter Overview
3.2. Forecast Methodology
3.2.1. Top-down Approach
3.2.2. Bottom-up Approach
3.2.3. Hybrid Approach
3.3. Market Assessment Framework
3.3.1. Total Addressable Market (TAM)
3.3.2. Serviceable Addressable Market (SAM)
3.3.3. Serviceable Obtainable Market (SOM)
3.3.4. Currently Acquired Market (CAM)
3.4. Forecasting Tools and Techniques
3.4.1. Qualitative Forecasting
3.4.2. Correlation
3.4.3. Regression
3.4.4. Extrapolation
3.4.5. Convergence
3.4.6. Sensitivity Analysis
3.4.7. Scenario Planning
3.4.8. Data Visualization
3.4.9. Time Series Analysis
3.4.10. Forecast Error Analysis
3.5. Key Considerations
3.5.1. Demographics
3.5.2. Government Regulations
3.5.3. Reimbursement Scenarios
3.5.4. Market Access
3.5.5. Supply Chain
3.5.6. Industry Consolidation
3.5.7. Pandemic / Unforeseen Disruptions Impact
3.6. Limitations
4.1. Chapter Overview
4.2. Market Dynamics
4.2.1. Time Period
4.2.1.1. Historical Trends
4.2.1.2. Current and Forecasted Estimates
4.2.2. Currency Coverage
4.2.2.1. Major Currencies Affecting the Market
4.2.2.2. Factors Affecting Currency Fluctuations
4.2.2.3. Impact of Currency Fluctuations on the Industry
4.2.3. Foreign Currency Exchange Rate
4.2.3.1. Impact of Foreign Exchange Rate Volatility on the Market
4.2.3.2. Strategies for Mitigating Foreign Exchange Risk
4.2.4. Recession
4.2.4.1. Assessment of Current Economic Conditions and Potential Impact on the Market
4.2.4.2. Historical Analysis of Past Recessions and Lessons Learnt
4.2.5. Inflation
4.2.5.1. Measurement and Analysis of Inflationary Pressures in the Economy
4.2.5.2. Potential Impact of Inflation on the Market Evolution
4.2.6. Interest Rates
4.2.6.1. Interest Rates and Their Impact on the Market
4.2.6.2. Strategies for Managing Interest Rate Risk
4.2.7. Commodity Flow Analysis
4.2.7.1. Type of Commodity
4.2.7.2. Origins and Destinations
4.2.7.3. Values and Weights
4.2.7.4. Modes of Transportation
4.2.8. Global Trade Dynamics
4.2.8.1. Import Scenario
4.2.8.2. Export Scenario
4.2.8.3. Trade Policies
4.2.8.4. Strategies for Mitigating the Risks Associated with Trade Barriers
4.2.8.5. Impact of Trade Barriers on the Market
4.2.9. War Impact Analysis
4.2.9.1. Russian-Ukraine War
4.2.9.2. Israel-Hamas War
4.2.10. COVID Impact / Related Factors
4.2.10.1. Global Economic Impact
4.2.10.2. Industry-specific Impact
4.2.10.3. Government Response and Stimulus Measures
4.2.10.4. Future Outlook and Adaptation Strategies
4.2.11. Other Indicators
4.2.11.1. Fiscal Policy
4.2.11.2. Consumer Spending
4.2.11.3. Gross Domestic Product
4.2.11.4. Employment
4.2.11.5. Taxes
4.2.11.6. Stock Market Performance
4.2.11.7. Cross Border Dynamics
4.3. Conclusion
5.1. Executive Summary: Market Landscape
5.2. Executive Summary: Market Trends
5.3. Executive Summary: Market Forecast and Opportunity Analysis
6.1. Chapter Overview
6.2. Overview of Diabetes
6.2.1. Classification of Diabetes
6.2.1.1. Type 1 Diabetes
6.2.1.2. Type 2 Diabetes
6.2.1.3. Gestational Diabetes
6.3. Key Challenges Associated with Blood Glucose Monitoring
6.4. Blood Glucose Monitoring Devices
6.4.1. Devices for Self-Monitoring of Blood Glucose Levels
6.4.1.1. Blood Glucose Meter
6.4.1.2. Testing Strips
6.4.1.3. Lancets
6.4.2. Continuous Blood Glucose Monitoring Devices
6.4.2.1. Sensors
6.4.2.2. Transmitters
6.4.2.3. Receivers
6.4.2.4. Patches
6.5. Future Perspectives
7.1. Chapter Overview
7.2. Blood Glucose Monitoring Devices: Overall Market Landscape
7.2.1. Analysis by Type of Device
7.2.2. Analysis by Current Status of Development
7.2.3. Analysis by Target Patient Segment
7.2.4. Analysis by Analyte Procurement
7.2.5. Analysis by Volume of Analyte Used
7.2.6. Analysis by Processing Speed
7.2.7. Analysis by Wearability
7.2.8. Analysis by Wireless Connectivity
7.2.9. Analysis by Water Resistance Potential
7.2.10. Analysis by Provisions for Alerts / Alarms
7.2.11. Analysis by Device Memory Attributes
7.2.12. Analysis by Glucose Measurement Range
7.3. Blood Glucose Monitoring Devices: List of Developers
7.3.1. Analysis by Type of Developer
7.3.2. Analysis by Year of Establishment
7.3.3. Analysis by Company Size
7.3.4. Analysis by Geographical Location
7.3.5. Leading Developers: Analysis by Number of Products
8.1. Chapter Overview
8.2. Assumptions and Methodology
8.2.1. Product Competitiveness Analysis: Blood Glucose Monitoring Devices
8.2.1.1. Product Competitiveness Analysis: Continuous Blood Glucose Monitoring Devices
8.2.1.2. Product Competitiveness Analysis: Self-Monitoring Blood Glucose Devices
9.1. Chapter Overview
9.2. Partnership Models
9.3. Blood Glucose Monitoring Devices: List of Partnerships and Collaborations
9.3.1. Analysis by Year of Partnership
9.3.2. Analysis by Type of Partnership
9.3.3. Analysis by Year and Type of Partnership
9.3.4. Analysis by Type of Device
9.3.5. Most Active Players: Analysis by Number of Partnerships
9.3.6. Geographical Analysis
9.3.6.1. Region-wise Distribution
9.3.6.2. Country-wise Distribution
10.1. Chapter Overview
10.2. ApexBio
10.2.1. Company Overview
10.2.2. Blood Glucose Monitoring Devices Portfolio
10.2.3. Recent Developments and Future Outlook
10.3. Ascensia Diabetes Care
10.3.1. Company Overview
10.3.2. Blood Glucose Monitoring Devices Portfolio
10.3.3. Recent Developments and Future Outlook
10.4. i-SENS
10.4.1. Company Overview
10.4.2. Blood Glucose Monitoring Devices Portfolio
10.4.3. Recent Developments and Future Outlook
10.5. Oak Tree Health
10.5.1. Company Overview
10.5.2. Blood Glucose Monitoring Devices Portfolio
10.5.3. Recent Developments and Future Outlook
10.6. SD Biosensor
10.6.1. Company Overview
10.6.2. Blood Glucose Monitoring Devices Portfolio
10.6.3. Recent Developments and Future Outlook
10.7. TaiDoc Technology
10.7.1. Company Overview
10.7.2. Blood Glucose Monitoring Devices Portfolio
10.7.3. Recent Developments and Future Outlook
10.8. VivaCheck Laboratories
10.8.1. Company Overview
10.8.2. Blood Glucose Monitoring Devices Portfolio
10.8.3. Recent Developments and Future Outlook
11.1. Chapter Overview
11.2. Scope and Methodology
11.3. Initiatives of Big Pharma Players
11.3.1. Analysis by Type of Disease Management Solution
11.3.2. Analysis by Number of Marketed and Clinical-Stage Diabetes Drugs
11.3.3. Analysis by Diabetes Type
11.3.4. Analysis by Type of Drug
11.3.5. Analysis by Number of Partnerships
11.4. Competitive Benchmarking of Big Pharma Players
11.4.1. Spider Web Analysis: Company A
11.4.2. Spider Web Analysis: Company B
11.4.3. Spider Web Analysis: Company C
11.4.4. Spider Web Analysis: Company D
11.4.5. Spider Web Analysis: Company E
12.1. Chapter Overview
12.2. Key Assumptions and Methodology
12.3. Global Blood Glucose Monitoring Devices Market, Historical Trends (Since 2020) and Forecasted Estimates (Till 2035)
12.3.1. Scenario Analysis
12.3.1.1. Conservative Scenario
12.3.1.2. Optimistic Scenario
12.4. Key Market Segmentations
13.1. Chapter Overview
13.2. Key Assumptions and Methodology
13.3. Blood Glucose Monitoring Devices Market: Distribution by Type of Device
13.3.1. Blood Glucose Monitoring Devices Market for Continuous Glucose Monitoring Devices, Historical Trends (Since 2020) and Forecasted Estimates (Till 2035)
13.3.2. Blood Glucose Monitoring Devices Market for Self-Monitoring of Blood Glucose Devices, Historical Trends (Since 2020) and Forecasted Estimates (Till 2035)
13.4. Data Triangulation and Validation
14.1. Chapter Overview
14.2. Key Assumptions and Methodology
14.3. Continuous Glucose Monitoring Devices Market: Distribution by Type of Diabetes
14.3.1. Continuous Glucose Monitoring Devices Market for Type 1 Diabetes, Historical Trends (Since 2020) and Forecasted Estimates (Till 2035)
14.3.2. Continuous Glucose Monitoring Devices Market for Type 2 Diabetes, Historical Trends (Since 2020) and Forecasted Estimates (Till 2035)
14.4. Self-Monitoring of Blood Glucose Devices Market: Distribution by Type of Diabetes
14.4.1. Self-Monitoring of Blood Glucose Devices Market for Type 1 Diabetes, Historical Trends (Since 2020) and Forecasted Estimates (Till 2035)
14.4.2. Self-Monitoring of Blood Glucose Devices Market for Type 2 Diabetes, Historical Trends (Since 2020) and Forecasted Estimates (Till 2035)
14.5. Data Triangulation and Validation
15.1. Chapter Overview
15.2. Key Assumptions and Methodology
15.3. Continuous Glucose Monitoring Devices Market: Distribution by Component
15.3.1. Continuous Glucose Monitoring Devices Market for Sensors and Transmitters, Historical Trends (Since 2020) and Forecasted Estimates (Till 2035)
15.3.2. Continuous Glucose Monitoring Devices Market for Receivers, Historical Trends (Since 2020) and Forecasted Estimates (Till 2035)
15.4. Self-Monitoring of Blood Glucose Devices Market: Distribution by Component
15.4.1. Self-Monitoring of Blood Glucose Devices Market for Testing Strips, Historical Trends (Since 2020) and Forecasted Estimates (Till 2035)
15.4.2. Self-Monitoring of Blood Glucose Devices Market for Lancets and Lancing Devices, Historical Trends (Since 2020) and Forecasted Estimates (Till 2035)
15.4.3. Self-Monitoring of Blood Glucose Devices Market for Blood Glucose Meters, Historical Trends (Since 2020) and Forecasted Estimates (Till 2035)
15.5. Data Triangulation and Validation
16.1. Chapter Overview
16.2. Key Assumptions and Methodology
16.3. Continuous Glucose Monitoring Devices Market: Distribution by Geographical Regions
16.3.1. Continuous Glucose Monitoring Devices Market in North America, Historical Trends (Since 2020) and Forecasted Estimates (Till 2035)
16.3.1.1. Continuous Glucose Monitoring Devices Market in the US, Historical Trends (Since 2020) and Forecasted Estimates (Till 2035)
16.3.1.2. Continuous Glucose Monitoring Devices Market in Mexico, Historical Trends (Since 2020) and Forecasted Estimates (Till 2035)
16.3.1.3. Continuous Glucose Monitoring Devices Market in Canada, Historical Trends (Since 2020) and Forecasted Estimates (Till 2035)
16.3.2. Continuous Glucose Monitoring Devices Market in Europe, Historical Trends (Since 2020) and Forecasted Estimates (Till 2035)
16.3.2.1. Continuous Glucose Monitoring Devices Market in Germany, Historical Trends (Since 2020) and Forecasted Estimates (Till 2035)
16.3.2.2. Continuous Glucose Monitoring Devices Market in the UK, Historical Trends (Since 2020) and Forecasted Estimates (Till 2035)
16.3.2.3. Continuous Glucose Monitoring Devices Market in Spain, Historical Trends (Since 2020) and Forecasted Estimates (Till 2035)
16.3.2.4. Continuous Glucose Monitoring Devices Market in France, Historical Trends (Since 2020) and Forecasted Estimates (Till 2035)
16.3.2.5. Continuous Glucose Monitoring Devices Market in Italy, Historical Trends (Since 2020) and Forecasted Estimates (Till 2035)
16.3.2.6. Continuous Glucose Monitoring Devices Market in Rest of Europe, Historical Trends (Since 2020) and Forecasted Estimates (Till 2035)
16.3.3. Continuous Glucose Monitoring Devices Market in Asia-Pacific, Historical Trends (Since 2020) and Forecasted Estimates (Till 2035)
16.3.3.1. Continuous Glucose Monitoring Devices Market in China, Historical Trends (Since 2020) and Forecasted Estimates (Till 2035)
16.3.3.2. Continuous Glucose Monitoring Devices Market in India, Historical Trends (Since 2020) and Forecasted Estimates (Till 2035)
16.3.3.3. Continuous Glucose Monitoring Devices Market in Japan, Historical Trends (Since 2020) and Forecasted Estimates (Till 2035)
16.3.3.4. Continuous Glucose Monitoring Devices Market in South Korea, Historical Trends (Since 2020) and Forecasted Estimates (Till 2035)
16.3.4. Continuous Glucose Monitoring Devices Market in Middle East and North Africa, Historical Trends (Since 2020) and Forecasted Estimates (Till 2035)
16.3.4.1. Continuous Glucose Monitoring Devices Market in Egypt, Historical Trends (Since 2020) and Forecasted Estimates (Till 2035)
16.3.4.2. Continuous Glucose Monitoring Devices Market in Saudi Arabia, Historical Trends (Since 2020) and Forecasted Estimates (Till 2035)
16.3.4.3. Continuous Glucose Monitoring Devices Market in Israel, Historical Trends (Since 2020) and Forecasted Estimates (Till 2035)
16.3.5. Continuous Glucose Monitoring Devices Market in Latin America, Historical Trends (Since 2020) and Forecasted Estimates (Till 2035)
16.3.5.1. Continuous Glucose Monitoring Devices Market in Brazil, Historical Trends (Since 2020) and Forecasted Estimates (Till 2035)
16.3.5.2. Continuous Glucose Monitoring Devices Market in Argentina, Historical Trends (Since 2020) and Forecasted Estimates (Till 2035)
16.4. Self-Monitoring of Blood Glucose Devices Market: Distribution by Geographical Regions
16.4.1. Self-Monitoring of Blood Glucose Devices Market in North America, Historical Trends (Since 2020) and Forecasted Estimates (Till 2035)
16.4.1.1. Self-Monitoring of Blood Glucose Devices Market in the US, Historical Trends (Since 2020) and Forecasted Estimates (Till 2035)
16.4.1.2. Self-Monitoring of Blood Glucose Devices Market in Mexico, Historical Trends (Since 2020) and Forecasted Estimates (Till 2035)
16.4.1.3. Self-Monitoring of Blood Glucose Devices Market in Canada, Historical Trends (Since 2020) and Forecasted Estimates (Till 2035)
16.4.2. Self-Monitoring of Blood Glucose Devices Market in Europe, Historical Trends (Since 2020) and Forecasted Estimates (Till 2035)
16.4.2.1. Self-Monitoring of Blood Glucose Devices Market in Germany, Historical Trends (Since 2020) and Forecasted Estimates (Till 2035)
16.4.2.2. Self-Monitoring of Blood Glucose Devices Market in the UK, Historical Trends (Since 2020) and Forecasted Estimates (Till 2035)
16.4.2.3. Self-Monitoring of Blood Glucose Devices Market in Spain, Historical Trends (Since 2020) and Forecasted Estimates (Till 2035)
16.4.2.4. Self-Monitoring of Blood Glucose Devices Market in France, Historical Trends (Since 2020) and Forecasted Estimates (Till 2035)
16.4.2.5. Self-Monitoring of Blood Glucose Devices Market in Italy, Historical Trends (Since 2020) and Forecasted Estimates (Till 2035)
16.4.2.6. Self-Monitoring of Blood Glucose Devices Market in Rest of Europe, Historical Trends (Since 2020) and Forecasted Estimates (Till 2035)
16.4.3. Self-Monitoring of Blood Glucose Devices Market in Asia-Pacific, Historical Trends (Since 2020) and Forecasted Estimates (Till 2035)
16.4.3.1. Self-Monitoring of Blood Glucose Devices Market in China, Historical Trends (Since 2020) and Forecasted Estimates (Till 2035)
16.4.3.2. Self-Monitoring of Blood Glucose Devices Market in India, Historical Trends (Since 2020) and Forecasted Estimates (Till 2035)
16.4.3.3. Self-Monitoring of Blood Glucose Devices Market in Japan, Historical Trends (Since 2020) and Forecasted Estimates (Till 2035)
16.4.3.4. Self-Monitoring of Blood Glucose Devices Market in South Korea, Historical Trends (Since 2020) and Forecasted Estimates (Till 2035)
16.4.4. Self-Monitoring of Blood Glucose Devices Market in Middle East and North Africa, Historical Trends (Since 2020) and Forecasted Estimates (Till 2035)
16.4.4.1. Self-Monitoring of Blood Glucose Devices Market in Egypt, Historical Trends (Since 2020) and Forecasted Estimates (Till 2035)
16.4.4.2. Self-Monitoring of Blood Glucose Devices Market in Saudi Arabia, Historical Trends (Since 2020) and Forecasted Estimates (Till 2035)
16.4.4.3. Self-Monitoring of Blood Glucose Devices Market in Israel, Historical Trends (Since 2020) and Forecasted Estimates (Till 2035)
16.4.5. Self-Monitoring of Blood Glucose Devices Market in Latin America, Historical Trends (Since 2020) and Forecasted Estimates (Till 2035)
16.4.5.1. Self-Monitoring of Blood Glucose Devices Market in Brazil, Historical Trends (Since 2020) and Forecasted Estimates (Till 2035)
16.4.5.2. Self-Monitoring of Blood Glucose Devices Market in Argentina, Historical Trends (Since 2020) and Forecasted Estimates (Till 2035)
16.5. Market Dynamics Assessment
16.5.1. Market Movement Analysis
16.5.2. Penetration-Growth (P-G) Matrix
16.6. Data Triangulation and Validation
18.1. Chapter Overview
18.2. Company A
18.2.1. Company Snapshot
18.2.2. Interview Transcript: Founder and Chairman
18.3. Company B
18.3.1. Company Snapshot
18.3.2. Interview Transcript: General Manager- Business Development
18.4. Company C
18.4.1. Company Snapshot
18.4.2. Interview Transcript: Chief Executive Officer, and Chief Financial Officer
18.5. Company D
18.5.1. Company Snapshot
18.5.2. Interview Transcript: Chief Executive Officer
18.6. Company E
18.6.1. Company Snapshot
18.6.2. Interview Transcript: Chief Executive Officer
18.7. Company F
18.7.1. Company Snapshot
18.7.2. Interview Transcript: Chief Technology Officer
18.8. Company G
18.8.1. Company Snapshot
18.8.2. Interview Transcript: Chief Operating Officer
18.9. Company H
18.9.1. Company Snapshot
18.9.2. Interview Transcript: Director of Education and Training in Diabetes
18.10. Company I
18.10.1. Company Snapshot
18.10.2. Interview Transcript: Executive Vice President
18.11. Company J
18.11.1. Company Snapshot
18.11.2. Interview Transcript: Doctor
18.12. Company K
18.12.1. Company Snapshot
18.12.2. Interview Transcript: Clinical Associate Professor
18.13. Company L
18.13.1. Company Snapshot
18.13.2. Interview Transcript: Clinical Associate Professor
18.14. Company M
18.14.1. Company Snapshot
18.14.2. Interview Transcript: Clinical Lead for Diabetes
Figure 2.1 Research Methodology: Project Methodology
Figure 2.2 Research Methodology: Data Sources for Secondary Research
Figure 2.3 Research Methodology: Robust Quality Control
Figure 3.1 Market Dynamics: Forecast Methodology
Figure 3.2 Market Dynamics: Market Assessment Framework
Figure 4.1 Lessons Learnt from Past Recessions
Figure 5.1 Executive Summary: Market Landscape
Figure 5.2 Executive Summary: Market Sizing and Opportunity Analysis
Figure 7.1 Blood Glucose Monitoring Devices: Distribution by Type of Device
Figure 7.2 Blood Glucose Monitoring Devices: Distribution by Current Status of Development
Figure 7.3 Blood Glucose Monitoring Devices: Distribution by Type of Device and Current Status of Development
Figure 7.4 Blood Glucose Monitoring Devices: Distribution by Target Patient Segment
Figure 7.5 Blood Glucose Monitoring Devices: Distribution by Type of Device and Target Patient Segment
Figure 7.6 Blood Glucose Monitoring Devices: Distribution by Analyte Procurement
Figure 7.7 Blood Glucose Monitoring Devices: Distribution by Type of Device and Analyte Procurement
Figure 7.8 Blood Glucose Monitoring Devices: Distribution by Volume of Analyte Used
Figure 7.9 Blood Glucose Monitoring Devices: Distribution by Processing Speed
Figure 7.10 Blood Glucose Monitoring Devices: Distribution by Type of Device and Processing Speed
Figure 7.11 Blood Glucose Monitoring Devices: Distribution by Wearability
Figure 7.12 Blood Glucose Monitoring Devices: Distribution by Wireless Connectivity
Figure 7.13 Blood Glucose Monitoring Devices: Distribution by Type of Device and Wireless Connectivity
Figure 7.14 Blood Glucose Monitoring Devices: Distribution by Water Resistance Potential
Figure 7.15 Blood Glucose Monitoring Devices: Distribution by Type of Device and Water Resistance Potential
Figure 7.16 Blood Glucose Monitoring Devices: Distribution by Provisions for Alerts / Alarms
Figure 7.17 Blood Glucose Monitoring Devices: Distribution by Type of Device and Provisions for Alerts / Alarms
Figure 7.18 Blood Glucose Monitoring Devices: Distribution by Device Memory Attributes
Figure 7.19 Blood Glucose Monitoring Devices: Distribution by Glucose Measurement Range
Figure 7.20 Blood Glucose Monitoring Device Developers: Distribution by Type of Stakeholder
Figure 7.21 Blood Glucose Monitoring Device Developers: Distribution by Year of Establishment
Figure 7.22 Blood Glucose Monitoring Device Developers: Distribution by Company Size
Figure 7.23 Blood Glucose Monitoring Device Developers: Geographical Distribution by Location of Headquarters
Figure 7.24 Leading Developers: Analysis by Number of Products
Figure 8.1 Continuous Blood Glucose Monitoring Devices: Dot Plot Analysis
Figure 8.2 Product Competitiveness Analysis: Continuous Blood Glucose Monitoring Devices
Figure 8.3 Self-Monitoring Blood Glucose Devices: Dot Plot Analysis
Figure 8.4 Product Competitiveness Analysis: Self-Monitoring Blood Glucose Devices
Figure 9.1 Partnerships and Collaborations: Distribution by Year of Partnership
Figure 9.2 Partnerships and Collaborations: Distribution by Type of Partnership
Figure 9.3 Partnerships and Collaborations: Distribution by Year and Type of Partnership
Figure 9.4 Partnerships and Collaborations: Distribution by Type of Device
Figure 9.5 Most Active Players: Analysis by Number of Partnerships
Figure 9.6 Partnerships and Collaborations: Region-wise Distribution
Figure 9.7 Partnerships and Collaborations: Country-wise Distribution
Figure 11.1 Big Pharma Initiatives: Heat Map Analysis of Top Pharmaceutical Companies
Figure 11.2 Big Pharma Initiatives: Distribution by Type of Disease Management Solution
Figure 11.3 Big Pharma Initiatives: Distribution by Number of Marketed and Clinical-Stage Diabetes Drugs
Figure 11.4 Big Pharma Initiatives: Distribution by Diabetes Type
Figure 11.5 Big Pharma Initiatives: Distribution by Type of Drug
Figure 11.6 Big Pharma Initiatives: Distribution by Number of Partnerships
Figure 11.7 Spider Web Analysis: Company A
Figure 11.8 Spider Web Analysis: Company B
Figure 11.9 Spider Web Analysis: Company C
Figure 11.10 Spider Web Analysis: Company D
Figure 11.11 Spider Web Analysis: Company E
Figure 12.1 Global Blood Glucose Monitoring Devices Market, Historical Trends (Since 2020) and Forecasted Estimates (Till 2035) (USD Billion)
Figure 12.2 Global Blood Glucose Monitoring Devices Market, Forecasted Estimates (Till 2035): Conservative Scenario (USD Billion)
Figure 12.3 Global Blood Glucose Monitoring Devices Market, Forecasted Estimates (Till 2035): Optimistic Scenario (USD Billion)
Figure 13.1 Global Blood Glucose Monitoring Devices Market: Distribution by Type of Device
Figure 13.2 Blood Glucose Monitoring Devices Market for Continuous Glucose Monitoring Devices, Historical Trends (Since 2020) and Forecasted Estimates (Till 2035) (USD Billion)
Figure 13.3 Blood Glucose Monitoring Devices Market for Self-Monitoring of Blood Glucose Devices, Historical Trends (Since 2020) and Forecasted Estimates (Till 2035) (USD Billion)
Figure 14.1 Continuous Glucose Monitoring Devices Market: Distribution by Type of Diabetes
Figure 14.2 Continuous Glucose Monitoring Devices Market for Type 1 Diabetes, Historical Trends (Since 2020) and Forecasted Estimates (Till 2035) (USD Billion)
Figure 14.3 Continuous Glucose Monitoring Devices Market for Type 2 Diabetes, Historical Trends (Since 2020) and Forecasted Estimates (Till 2035) (USD Billion)
Figure 14.4 Self-Monitoring of Blood Glucose Devices Market: Distribution by Type of Diabetes
Figure 14.5 Self-Monitoring of Blood Glucose Devices Market for Type 1 Diabetes, Historical Trends (Since 2020) and Forecasted Estimates (Till 2035) (USD Billion)
Figure 14.6 Self-Monitoring of Blood Glucose Devices Market for Type 2 Diabetes, Historical Trends (Since 2020) and Forecasted Estimates (Till 2035) (USD Billion)
Figure 15.1 Continuous Glucose Monitoring Devices Market: Distribution by Component
Figure 15.2 Continuous Glucose Monitoring Devices Market for Sensors and Transmitters, Historical Trends (Since 2020) and Forecasted Estimates (Till 2035) (USD Billion)
Figure 15.3 Continuous Glucose Monitoring Devices Market for Receivers, Historical Trends (Since 2020) and Forecasted Estimates (Till 2035) (USD Billion)
Figure 15.4 Self-Monitoring of Blood Glucose Devices Market: Distribution by Component
Figure 15.5 Self-Monitoring of Blood Glucose Devices Market for Testing Strips, Historical Trends (Since 2020) and Forecasted Estimates (Till 2035) (USD Billion)
Figure 15.6 Self-Monitoring of Blood Glucose Devices Market for Lancets and Lancing Devices, Historical Trends (Since 2020) and Forecasted Estimates (Till 2035) (USD Billion)
Figure 15.7 Self-Monitoring of Blood Glucose Devices Market for Blood Glucose Meters, Historical Trends (Since 2020) and Forecasted Estimates (Till 2035) (USD Billion)
Figure 16.1 Continuous Glucose Monitoring Devices Market: Distribution by Geographical Regions
Figure 16.2 Continuous Glucose Monitoring Devices Market in North America, Historical Trends (Since 2020) and Forecasted Estimates (Till 2035) (USD Billion)
Figure 16.3 Continuous Glucose Monitoring Devices Market in the US, Historical Trends (Since 2020) and Forecasted Estimates (Till 2035) (USD Billion)
Figure 16.4 Continuous Glucose Monitoring Devices Market in Mexico, Historical Trends (Since 2020) and Forecasted Estimates (Till 2035) (USD Billion)
Figure 16.5 Continuous Glucose Monitoring Devices Market in Canada, Historical Trends (Since 2020) and Forecasted Estimates (Till 2035) (USD Billion)
Figure 16.6 Continuous Glucose Monitoring Devices Market in Europe, Historical Trends (Since 2020) and Forecasted Estimates (Till 2035) (USD Billion)
Figure 16.7 Continuous Glucose Monitoring Devices Market in Germany, Historical Trends (Since 2020) and Forecasted Estimates (Till 2035) (USD Billion)
Figure 16.8 Continuous Glucose Monitoring Devices Market in the UK, Historical Trends (Since 2020) and Forecasted Estimates (Till 2035) (USD Billion)
Figure 16.9 Continuous Glucose Monitoring Devices Market in Spain, Historical Trends (Since 2020) and Forecasted Estimates (Till 2035) (USD Billion)
Figure 16.10 Continuous Glucose Monitoring Devices Market in France, Historical Trends (Since 2020) and Forecasted Estimates (Till 2035) (USD Billion)
Figure 16.11 Continuous Glucose Monitoring Devices Market in Italy, Historical Trends (Since 2020) and Forecasted Estimates (Till 2035) (USD Billion)
Figure 16.12 Continuous Glucose Monitoring Devices Market in Rest of Europe, Historical Trends (Since 2020) and Forecasted Estimates (Till 2035) (USD Billion)
Figure 16.13 Continuous Glucose Monitoring Devices Market in Asia-Pacific, Historical Trends (Since 2020) and Forecasted Estimates (Till 2035) (USD Billion)
Figure 16.14 Continuous Glucose Monitoring Devices Market in China, Historical Trends (Since 2020) and Forecasted Estimates (Till 2035) (USD Billion)
Figure 16.15 Continuous Glucose Monitoring Devices Market in India, Historical Trends (Since 2020) and Forecasted Estimates (Till 2035) (USD Billion)
Figure 16.16 Continuous Glucose Monitoring Devices Market in Japan, Historical Trends (Since 2020) and Forecasted Estimates (Till 2035) (USD Billion)
Figure 16.17 Continuous Glucose Monitoring Devices Market in South Korea, Historical Trends (Since 2020) and Forecasted Estimates (Till 2035) (USD Billion)
Figure 16.18 Continuous Glucose Monitoring Devices Market in Middle East and North Africa, Historical Trends (Since 2020) and Forecasted Estimates (Till 2035) (USD Billion)
Figure 16.19 Continuous Glucose Monitoring Devices Market in Egypt, Historical Trends (Since 2020) and Forecasted Estimates (Till 2035) (USD Billion)
Figure 16.20 Continuous Glucose Monitoring Devices Market in Saudi Arabia, Historical Trends (Since 2020) and Forecasted Estimates (Till 2035) (USD Billion)
Figure 16.21 Continuous Glucose Monitoring Devices Market in Israel, Historical Trends (Since 2020) and Forecasted Estimates (Till 2035) (USD Billion)
Table 6.1 Blood Sugar Levels in Diabetic Patients
Table 6.2 Difference between Self-Monitoring and Continuous Monitoring Devices
Table 6.3 Glucose Monitoring Times and Frequency
Table 7.1 List of Blood Glucose Monitoring Devices
Table 7.2 Blood Glucose Monitoring Devices: List of Developers
Table 9.1 Blood Glucose Monitoring Devices: List of Partnerships
Table 10.1 Leading Blood Glucose Monitoring Device Developers
Table 10.2 ApexBio: Company Overview
Table 10.3 ApexBio: Blood Glucose Monitoring Devices
Table 10.4 Ascensia Diabetes Care: Company Overview
Table 10.5 Ascensia Diabetes Care: Blood Glucose Monitoring Devices
Table 10.6 Ascensia Diabetes Care: Recent Developments and Future Outlook
Table 10.7 i-SENS: Company Overview
Table 10.8 i-SENS: Blood Glucose Monitoring Devices
Table 10.9 i-SENS: Recent Developments and Future Outlook
Table 10.10 Oak Tree Health: Company Overview
Table 10.11 Oak Tree Health: Blood Glucose Monitoring Devices
Table 10.12 SD Biosensor: Company Overview
Table 10.13 SD Biosensor: Blood Glucose Monitoring Devices
Table 10.14 SD Biosensor: Recent Developments and Future Outlook
Table 10.15 TaiDoc Technology: Company Overview
Table 10.16 TaiDoc Technology: Blood Glucose Monitoring Devices
Table 10.17 VivaChek Laboratories: Company Overview
Table 10.18 VivaChek Laboratories: Blood Glucose Monitoring Devices
Table 10.19 VivaChek Laboratories: Recent Developments and Future Outlook
Table 11.1 Top Big Pharma Players in Diabetes Domain
Table 11.2 Big Pharma Players: Spider-Web Analysis (Input Data)
Table 11.3 Cambridge Consultants: Company Snapshot
Table 11.4 Know Labs: Company Snapshot
Table 19.1 Blood Glucose Monitoring Devices: Distribution by Type of Device
Table 19.2 Blood Glucose Monitoring Devices: Distribution by Current Status of Development
Table 19.3 Blood Glucose Monitoring Devices: Distribution by Type of Device and Current Status of Development
Table 19.4 Blood Glucose Monitoring Devices: Distribution by Target Patient Segment
Table 19.5 Blood Glucose Monitoring Devices: Distribution by Type of Device and Target Patient Segment
Table 19.6 Blood Glucose Monitoring Devices: Distribution by Analyte Procurement
Table 19.7 Blood Glucose Monitoring Devices: Distribution by Type of Device and Analyte Procurement
Table 19.8 Blood Glucose Monitoring Devices: Distribution by Volume of Analyte Used
Table 19.9 Blood Glucose Monitoring Devices: Distribution by Processing Speed
Table 19.10 Blood Glucose Monitoring Devices: Distribution by Type of Device and Processing Speed
Table 19.11 Blood Glucose Monitoring Devices: Distribution by Wearability
Table 19.12 Blood Glucose Monitoring Devices: Distribution by Wireless Connectivity
Table 19.13 Blood Glucose Monitoring Devices: Distribution by Type of Device and Wireless Connectivity
Table 19.14 Blood Glucose Monitoring Devices: Distribution by Water Resistance Potential
Table 19.15 Blood Glucose Monitoring Devices: Distribution by Type of Device and Water Resistance Potential
Table 19.16 Blood Glucose Monitoring Devices: Distribution by Provisions for Alerts / Alarms
Table 19.17 Blood Glucose Monitoring Devices: Distribution by Type of Device and Provisions for Alerts / Alarms
Table 19.18 Blood Glucose Monitoring Devices: Distribution by Device Memory Attributes
Table 19.19 Blood Glucose Monitoring Devices: Distribution by Glucose Measurement Range
Table 19.20 Blood Glucose Monitoring Device Developers: Distribution by Type of Stakeholder
Table 19.21 Blood Glucose Monitoring Device Developers: Distribution by Year of Establishment
Table 19.22 Blood Glucose Monitoring Device Developers: Distribution by Company Size
Table 19.23 Blood Glucose Monitoring Device Developers: Geographical Distribution by Location of Headquarters
Table 19.24 Leading Developers: Analysis by Number of Products
Table 19.25 Continuous Blood Glucose Monitoring Devices: Dot Plot Analysis
Table 19.26 Product Competitiveness Analysis: Continuous Blood Glucose Monitoring Devices
Table 19.27 Self-Monitoring Blood Glucose Devices: Dot Plot Analysis
Table 19.28 Product Competitiveness Analysis: Self-Monitoring Blood Glucose Devices
Table 19.29 Partnerships and Collaborations: Distribution by Year of Partnership
Table 19.30 Partnerships and Collaborations: Distribution by Type of Partnership
Table 19.31 Partnerships and Collaborations: Distribution by Year and Type of Partnership
Table 19.32 Partnerships and Collaborations: Distribution by Type of Device
Table 19.33 Most Active Players: Analysis by Number of Partnerships
Table 19.34 Partnerships and Collaborations: Region-wise Distribution
Table 19.35 Partnerships and Collaborations: Country-wise Distribution
Table 19.36 Big Pharma Initiatives: Heat Map Analysis of Top Pharmaceutical Companies
Table 19.37 Big Pharma Initiatives: Distribution by Type of Disease Management Solution
Table 19.38 Big Pharma Initiatives: Distribution by Number of Marketed and Clinical-Stage Diabetes Drugs
Table 19.39 Big Pharma Initiatives: Distribution by Diabetes Type
Table 19.40 Big Pharma Initiatives: Distribution by Type of Drug
Table 19.41 Big Pharma Initiatives: Distribution by Number of Partnerships
Table 19.42 Spider Web Analysis: Company A
Table 19.43 Spider Web Analysis: Company B
Table 19.44 Spider Web Analysis: Company C
Table 19.45 Spider Web Analysis: Company D
Table 19.46 Spider Web Analysis: Company E
Table 19.47 Global Blood Glucose Monitoring Devices Market, Historical Trends (Since 2020) and Forecasted Estimates (Till 2035) (USD Billion)
Table 19.48 Global Blood Glucose Monitoring Devices Market, Forecasted Estimates (Till 2035): Conservative Scenario (USD Billion)
Table 19.49 Global Blood Glucose Monitoring Devices Market, Forecasted Estimates (Till 2035): Optimistic Scenario (USD Billion)
Table 19.50 Global Blood Glucose Monitoring Devices Market: Distribution by Type of Device
Table 19.51 Blood Glucose Monitoring Devices Market for Continuous Glucose Monitoring Devices, Historical Trends (Since 2020) and Forecasted Estimates (Till 2035): Conservative, Base and Optimistic Scenarios (USD Billion)
Table 19.52 Blood Glucose Monitoring Devices Market for Self-Monitoring of Blood Glucose Devices, Historical Trends (Since 2020) and Forecasted Estimates (Till 2035): Conservative, Base and Optimistic Scenarios (USD Billion)
Table 19.53 Continuous Glucose Monitoring Devices Market: Distribution by Type of Diabetes
Table 19.54 Continuous Glucose Monitoring Devices Market for Type 1 Diabetes, Historical Trends (Since 2020) and Forecasted Estimates (Till 2035): Conservative, Base and Optimistic Scenarios (USD Billion)
Table 19.55 Continuous Glucose Monitoring Devices Market for Type 2 Diabetes, Historical Trends (Since 2020) and Forecasted Estimates (Till 2035): Conservative, Base and Optimistic Scenarios (USD Billion)
Table 19.56 Self-Monitoring of Blood Glucose Devices Market: Distribution by Type of Diabetes
Table 19.57 Self-Monitoring of Blood Glucose Devices Market for Type 1 Diabetes, Historical Trends (Since 2020) and Forecasted Estimates (Till 2035): Conservative, Base and Optimistic Scenarios (USD Billion)
Table 19.58 Self-Monitoring of Blood Glucose Devices Market for Type 2 Diabetes, Historical Trends (Since 2020) and Forecasted Estimates (Till 2035): Conservative, Base and Optimistic Scenarios (USD Billion)
Table 19.59 Continuous Glucose Monitoring Devices Market: Distribution by Component
Table 19.60 Continuous Glucose Monitoring Devices Market for Sensors and Transmitters, Historical Trends (Since 2020) and Forecasted Estimates (Till 2035): Conservative, Base and Optimistic Scenarios (USD Billion)
Table 19.61 Continuous Glucose Monitoring Devices Market for Receivers, Historical Trends (Since 2020) and Forecasted Estimates (Till 2035): Conservative, Base and Optimistic Scenarios (USD Billion)
Table 19.62 Self-Monitoring of Blood Glucose Devices Market: Distribution by Component
Table 19.63 Self-Monitoring of Blood Glucose Devices Market for Testing Strips, Historical Trends (Since 2020) and Forecasted Estimates (Till 2035): Conservative, Base and Optimistic Scenarios (USD Billion)
Table 19.64 Self-Monitoring of Blood Glucose Devices Market for Lancets and Lancing Devices, Historical Trends (Since 2020) and Forecasted Estimates (Till 2035): Conservative, Base and Optimistic Scenarios (USD Billion)
Table 19.65 Self-Monitoring of Blood Glucose Devices Market for Blood Glucose Meters, Historical Trends (Since 2020) and Forecasted Estimates (Till 2035): Conservative, Base and Optimistic Scenarios (USD Billion)
Table 19.66 Continuous Glucose Monitoring Devices Market: Distribution by Geographical Regions
Table 19.67 Continuous Glucose Monitoring Devices Market in North America, Historical Trends (Since 2020) and Forecasted Estimates (Till 2035): Conservative, Base and Optimistic Scenarios (USD Billion)
Table 19.68 Continuous Glucose Monitoring Devices Market in the US, Historical Trends (Since 2020) and Forecasted Estimates (Till 2035): Conservative, Base and Optimistic Scenarios (USD Billion)
Table 19.69 Continuous Glucose Monitoring Devices Market in Mexico, Historical Trends (Since 2020) and Forecasted Estimates (Till 2035): Conservative, Base and Optimistic Scenarios (USD Billion)
Table 19.70 Continuous Glucose Monitoring Devices Market in Canada, Historical Trends (Since 2020) and Forecasted Estimates (Till 2035): Conservative, Base and Optimistic Scenarios (USD Billion)
Table 19.71 Continuous Glucose Monitoring Devices Market in Europe, Historical Trends (Since 2020) and Forecasted Estimates (Till 2035): Conservative, Base and Optimistic Scenarios (USD Billion)
Table 19.72 Continuous Glucose Monitoring Devices Market in Germany, Historical Trends (Since 2020) and Forecasted Estimates (Till 2035): Conservative, Base and Optimistic Scenarios (USD Billion)
Table 19.73 Continuous Glucose Monitoring Devices Market in the UK, Historical Trends (Since 2020) and Forecasted Estimates (Till 2035): Conservative, Base and Optimistic Scenarios (USD Billion)
Table 19.74 Continuous Glucose Monitoring Devices Market in Spain, Historical Trends (Since 2020) and Forecasted Estimates (Till 2035): Conservative, Base and Optimistic Scenarios (USD Billion)
Table 19.75 Continuous Glucose Monitoring Devices Market in France, Historical Trends (Since 2020) and Forecasted Estimates (Till 2035): Conservative, Base and Optimistic Scenarios (USD Billion)
Table 19.76 Continuous Glucose Monitoring Devices Market in Italy, Historical Trends (Since 2020) and Forecasted Estimates (Till 2035): Conservative, Base and Optimistic Scenarios (USD Billion)
Table 19.77 Continuous Glucose Monitoring Devices Market in Rest of Europe, Historical Trends (Since 2020) and Forecasted Estimates (Till 2035): Conservative, Base and Optimistic Scenarios (USD Billion)
Table 19.78 Continuous Glucose Monitoring Devices Market in Asia-Pacific, Historical Trends (Since 2020) and Forecasted Estimates (Till 2035): Conservative, Base and Optimistic Scenarios (USD Billion)
Table 19.79 Continuous Glucose Monitoring Devices Market in China, Historical Trends (Since 2020) and Forecasted Estimates (Till 2035): Conservative, Base and Optimistic Scenarios (USD Billion)
Table 19.80 Continuous Glucose Monitoring Devices Market in India, Historical Trends (Since 2020) and Forecasted Estimates (Till 2035): Conservative, Base and Optimistic Scenarios (USD Billion)
Table 19.81 Continuous Glucose Monitoring Devices Market in Japan, Historical Trends (Since 2020) and Forecasted Estimates (Till 2035): Conservative, Base and Optimistic Scenarios (USD Billion)
Table 19.82 Continuous Glucose Monitoring Devices Market in South Korea, Historical Trends (Since 2020) and Forecasted Estimates (Till 2035): Conservative, Base and Optimistic Scenarios (USD Billion)
Table 19.83 Continuous Glucose Monitoring Devices Market in Middle East and North Africa, Historical Trends (Since 2020) and Forecasted Estimates (Till 2035): Conservative, Base and Optimistic Scenarios (USD Billion)
Table 19.84 Continuous Glucose Monitoring Devices Market in Egypt, Historical Trends (Since 2020) and Forecasted Estimates (Till 2035): Conservative, Base and Optimistic Scenarios (USD Billion)
Table 19.85 Continuous Glucose Monitoring Devices Market in Saudi Arabia, Historical Trends (Since 2020) and Forecasted Estimates (Till 2035): Conservative, Base and Optimistic Scenarios (USD Billion)
Table 19.86 Continuous Glucose Monitoring Devices Market in Israel, Historical Trends (Since 2020) and Forecasted Estimates (Till 2035): Conservative, Base and Optimistic Scenarios (USD Billion)