


 Download Free Sample
 Buy Now
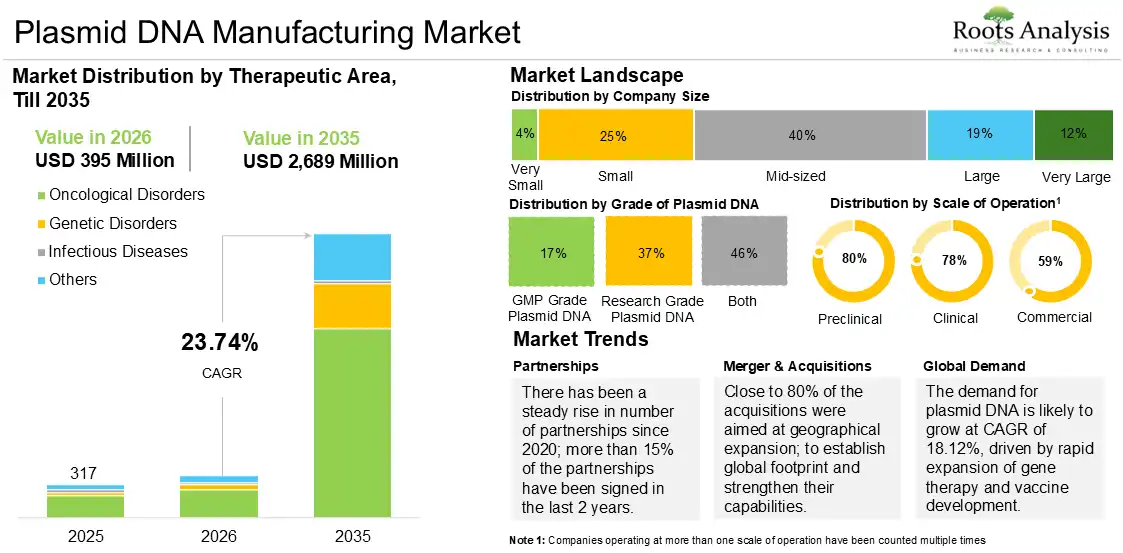
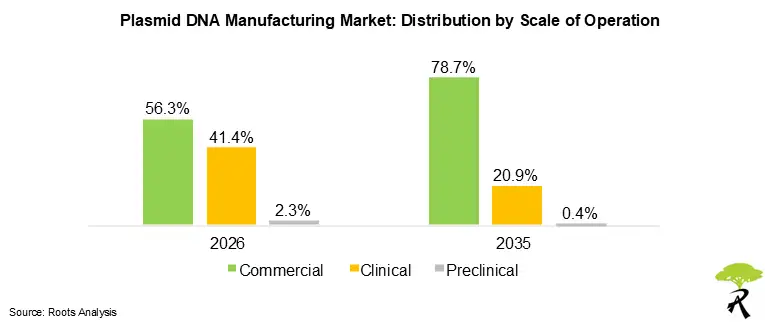
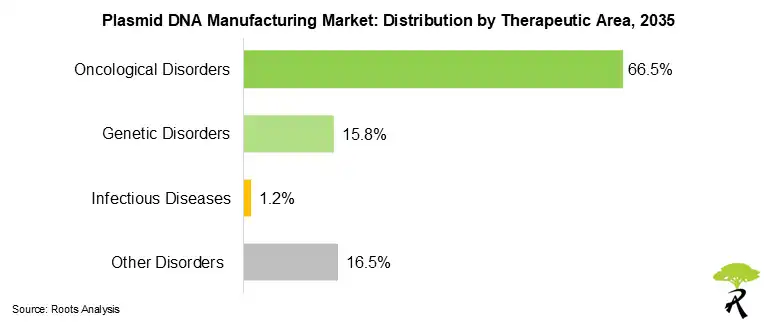
Table of Contents
1.1. Introduction
1.2. Market Share Insights
1.3. Key Market Insights
1.4. Report Coverage
1.5. Key Questions Answered
2.1. Chapter Overview
2.2. Research Assumptions
2.2.1. Market Landscape and Market Trends
2.2.2. Market Forecast and Opportunity Analysis
2.2.3. Comparative Analysis
2.3. Database Building
2.3.1. Data Collection
2.3.2. Data Validation
2.3.3. Data Analysis
2.4. Project Methodology
2.4.1. Secondary Research
2.4.1.1. Annual Reports
2.4.1.2. Academic Research Papers
2.4.1.3. Company Websites
2.4.1.4. Investor Presentations
2.4.1.5. Regulatory Filings
2.4.1.6. White Papers
2.4.1.7. Industry Publications
2.4.1.8. Conferences and Seminars
2.4.1.9. Government Portals
2.4.1.10. Media and Press Releases
2.4.1.11. Newsletters
2.4.1.12. Industry Databases
2.4.1.13. Roots Proprietary Databases
2.4.1.14. Paid Databases and Sources
2.4.1.15. Social Media Portals
2.4.1.16. Other Secondary Sources
2.4.2. Primary Research
2.4.2.1. Types of Primary Research
2.4.2.1.1. Qualitative Research
2.4.2.1.2. Quantitative Research
2.4.2.1.3. Hybrid Approach
2.4.2.2. Advantages of Primary Research
2.4.2.3. Techniques for Primary
Research
2.4.2.3.1. Interviews
2.4.2.3.2. Surveys
2.4.2.3.3. Focus Groups
2.4.2.3.4. Observational Research
2.4.2.3.5. Social Media Interactions
2.4.2.4. Key Opinion Leaders Considered in Primary Research
2.4.2.4.1. Company Executives (CXOs)
2.4.2.4.2. Board of Directors
2.4.2.4.3. Company Presidents and Vice Presidents
2.4.2.4.4. Research and Development Heads
2.4.2.4.5. Technical Experts
2.4.2.4.6. Subject Matter Experts
2.4.2.4.7. Scientists
2.4.2.4.8. Doctors and Other Healthcare Providers
2.4.2.5. Ethics and Integrity
2.4.2.5.1. Research Ethics
2.4.2.5.2. Data Integrity
2.4.3. Analytical Tools and Databases
2.5. Robust Quality Control
3.1. Chapter Overview
3.2. Forecast Methodology
3.2.1. Top-down Approach
3.2.2. Bottom-up Approach
3.2.3. Hybrid Approach
3.3. Market Assessment Framework
3.3.1. Total Addressable Market (TAM)
3.3.2. Serviceable Addressable Market (SAM)
3.3.3. Serviceable Obtainable Market (SOM)
3.3.4. Currently Acquired Market (CAM)
3.4. Forecasting Tools and Techniques
3.4.1. Qualitative Forecasting
3.4.2. Correlation
3.4.3. Regression
3.4.4. Extrapolation
3.4.5. Convergence
3.4.6. Sensitivity Analysis
3.4.7. Scenario Planning
3.4.8. Data Visualization
3.4.9. Time Series Analysis
3.4.10. Forecast Error Analysis
3.5. Key Considerations
3.5.1. Demographics
3.5.2. Government Regulations
3.5.3. Reimbursement Scenarios
3.5.4. Market Access
3.5.5. Supply Chain
3.5.6. Industry Consolidation
3.5.7. Pandemic / Unforeseen Disruptions Impact
3.6. Limitations
4.1. Chapter Overview
4.2. Market Dynamics
4.2.1. Time Period
4.2.1.1. Historical Trends
4.2.1.2. Current and Forecasted Estimates
4.2.2. Currency Coverage
4.2.2.1. Major Currencies Affecting the Market
4.2.2.2. Factors Affecting Currency Fluctuations
4.2.2.3. Impact of Currency Fluctuations on the Industry
4.2.3. Foreign Currency Exchange Rate
4.2.3.1. Impact of Foreign Exchange Rate Volatility on the Market
4.2.3.2. Strategies for Mitigating Foreign Exchange Risk
4.2.4. Recession
4.2.4.1. Assessment of Current Economic Conditions and Potential Impact on the Market
4.2.4.2. Historical Analysis of Past Recessions and Lessons Learnt
4.2.5. Inflation
4.2.5.1. Measurement and Analysis of Inflationary Pressures in the Economy
4.2.5.2. Potential Impact of Inflation on the Market Evolution
4.2.6. Interest Rates
4.2.6.1. Interest Rates and Their Impact on the Market
4.2.6.2. Strategies for Managing Interest Rate Risk
4.2.7. Commodity Flow Analysis
4.2.7.1. Type of Commodity
4.2.7.2. Origins and Destinations
4.2.7.3. Values and Weights
4.2.7.4. Modes of Transportation
4.2.8. Global Trade Dynamics
4.2.8.1. Import Scenario
4.2.8.2. Export Scenario
4.2.8.3. Trade Policies
4.2.8.4. Strategies for Mitigating the Risks Associated with Trade Barriers
4.2.8.5. Impact of Trade Barriers on the Market
4.2.9. War Impact Analysis
4.2.9.1. Russian-Ukraine War
4.2.9.2. Israel-Hamas War
4.2.10. COVID Impact / Related Factors
4.2.10.1. Global Economic Impact
4.2.10.2. Industry-specific Impact
4.2.10.3. Government Response and Stimulus Measures
4.2.10.4. Future Outlook and Adaptation Strategies
4.2.11. Other Indicators
4.2.11.1. Fiscal Policy
4.2.11.2. Consumer Spending
4.2.11.3. Gross Domestic Product
4.2.11.4. Employment
4.2.11.5. Taxes
4.2.11.6. Stock Market Performance
4.2.11.7. Cross Border Dynamics
4.3. Conclusion
5.1. Executive Summary: Market Landscape
5.2. Executive Summary: Market Trends
5.3. Executive Summary: Market Forecast and Opportunity
Analysis
6.1. Chapter Overview
6.2. Overview of Plasmid DNA
6.3. Structure of a plasmid DNA
6.4. Types of Plasmids (By
Function)
6.4.1. Fertility Plasmids
6.4.2. Resistance Plasmids
6.4.3. Virulence Plasmids
6.4.4. Degradative Plasmids
6.4.5. Col Plasmids
6.5. Plasmid DNA Manufacturing
6.5.1. Steps Involved in Plasmid DNA Manufacturing
6.6. Applications of Plasmid DNA in Pharmaceutical Industry
6.6.1. Cell and Gene Therapy Manufacturing
6.6.2. Viral Vector Manufacturing
6.6.3. Vaccine Development
6.6.4. Other Research Applications
6.7. Challenges Associated with Plasmid DNA Manufacturing
6.8. Need for Outsourcing Plasmid DNA Manufacturing
6.9. Future Perspectives
7.1. Chapter Overview
7.2. Plasmid DNA Service Providers: Overall Market Landscape
7.2.1. Analysis by Year of Establishment
7.2.2. Analysis by Company Size
7.2.3. Analysis by Location of Headquarters
7.2.4. Analysis by Type of Company
7.2.5. Analysis by Type of Venture
7.2.6. Analysis by Type of Service Offered
7.2.7. Analysis by Location of Manufacturing Facility
7.2.8. Analysis by Grade of Plasmid DNA
7.2.9. Analysis by Scale of Operation
7.2.10. Analysis by Application Area
7.2.11. Analysis by Portfolio / Offerings
8.1. Chapter Overview
8.2. Assumptions and Key Parameters
8.3. Methodology
8.4. Overview of Peer Groups
8.4.1. Peer Group I: Plasmid DNA Manufacturing Service Providers in North America
8.4.2. Peer Group II: Plasmid DNA Manufacturing Service Providers in Europe
8.4.3. Peer Group III: Plasmid DNA Manufacturing Service Providers in Asia-Pacific
8.5. Company Competitiveness Analysis
8.5.1. Plasmid DNA Manufacturing Service Providers based in North America
8.5.2. Peer Group II: Plasmid DNA Manufacturing Service Providers based in Europe
8.5.3. Peer Group III: Plasmid DNA Manufacturing Service Providers based in Asia-Pacific
9.1. Chapter Overview
9.2. Prominent Players
9.2.1. AGC Biologics
9.2.1.1. Company Overview
9.2.1.2. Service Portfolio
9.2.2. Aldevron (acquired by Danaher)
9.2.2.1. Company Overview
9.2.2.2. Service Portfolio
9.2.3. Catalent Pharma Solutions
(acquired by Novo Nordisk)
9.2.3.1. Company Overview
9.2.3.2. Service Portfolio
9.2.4. Charles River Laboratories
9.2.4.1. Company Overview
9.2.4.2. Service Portfolio
9.2.5. GenScript ProBio (a subsidiary of GenScript)
9.2.5.1. Company Overview
9.2.5.2. Service Portfolio
9.2.6. PackGene Biotech
9.2.6.1. Company Overview
9.2.6.2. Service Portfolio
9.2.7. VectorBuilder
9.2.7.1. Company Overview
9.2.7.2. Service Portfolio
9.2.8. VGXI
9.2.8.1. Company Overview
9.2.8.2. Service Portfolio
9.2.9. WuXi ATU (a subsidiary of WuXi AppTec)
9.2.9.1. Company Overview
9.2.9.2. Service Portfolio
9.2.10. Sartorius
9.2.10.1. Company Overview
9.2.10.2. Service Portfolio
9.3. Other Key Players
9.3.1. 53Biologics
9.3.1.1. Company Overview
9.3.1.2. Service Portfolio
9.3.2. ANEMOCYTE
9.3.2.1. Company Overview
9.3.2.2. Service Portfolio
9.3.3. Aurigene Pharmaceutical
Services
9.3.3.1. Company Overview
9.3.3.2. Service Portfolio
9.3.4. BioCina
9.3.4.1. Company Overview
9.3.4.2. Service Portfolio
9.3.5. 3PBiovian
9.3.5.1. Company Overview
9.3.5.2. Service Portfolio
9.3.6. Boehringer Ingelheim BioXcellence
9.3.6.1. Company Overview
9.3.6.2. Service Portfolio
9.3.7. Cytovance Biologics
9.3.7.1. Company Overview
9.3.7.2. Service Portfolio
9.3.8. Esco Aster (a subsidiary of
Esco Lifesciences)
9.3.8.1. Company Overview
9.3.8.2. Service Portfolio
9.3.9. Eurogentec (a subsidiary of Kaneka)
9.3.9.1. Company Overview
9.3.9.2. Service Portfolio
9.3.10. Forge Biologics
9.3.10.1. Company Overview
9.3.10.2. Service Portfolio
9.3.11. Hanmi Bio Plant (a Subsidiary of Hanmi Pharm)
9.3.11.1. Company Overview
9.3.11.2. Service Portfolio
9.3.12. NorthX Biologics
9.3.12.1. Company Overview
9.3.12.2. Service Portfolio
9.3.13. Patheon pharma services (acquired by Thermo Fisher Scientific)
9.3.13.1. Company Overview
9.3.13.2. Service Portfolio
9.3.14. Richter-Helm BioLogics
9.3.14.1. Company Overview
9.3.14.2. Service Portfolio
9.3.15. Southern RNA
9.3.15.1. Company Overview
9.3.15.2. Service Portfolio
10.1. Chapter Overview
10.2. Partnership Models
10.3. Plasmid DNA Manufacturing Service Providers: Partnerships and Collaborations
10.3.1. Cumulative Year-wise Trend of Partnerships
10.3.2. Analysis by Type of Partnership
10.3.3. Analysis by Year and Type of Partnership
10.3.4. Analysis by Type of Partner
10.3.5. Analysis by Grade of Plasmid DNA
10.3.6. Analysis by Scale of Operation
10.3.7. Most Active Players: Analysis by Number of Partnerships
10.3.8. Analysis by Geography
10.3.8.1. Local and International Agreements
10.3.8.2. Intercontinental and Intracontinental Agreements
11.1. Chapter Overview
11.2. Acquisitions Models and Key Value Drivers
11.3. Plasmid DNA Manufacturing Service Providers: Acquisitions
11.3.1. Analysis by Cumulative Year-wise Trend
11.3.2. Analysis by Type of Acquisition
11.3.3. Analysis by Year and Type of Acquisition
11.3.4. Analysis by Type of Company
11.3.5. Analysis by Business Globalization
11.3.6. Analysis by Portfolio / Expansion
11.3.7. Analysis By Type of Acquisition By Company Size of Acquirer Company
11.3.8. Analysis of Amount by Year and Type of Acquisitions
11.3.9. Most Active Players: Analysis by Number of Acquisitions
11.3.10. Most Active Players: Analysis by Number of Acquisitions
11.3.10.1. Local and International Agreements
11.3.10.2. Intercontinental and Intracontinental Agreements
12.1. Chapter Overview
12.2. Key Assumptions and Methodology
12.3. Plasmid DNA Manufacturing: Global Installed Capacity
12.3.1. Analysis by Company Size
12.3.2. Analysis by Grade of Plasmid DNA
12.3.3. Analysis by Scale of Operation
12.3.4. Analysis by Location of Manufacturing Facility
12.3.4.1. Analysis of Plasmid DNA Manufacturing Capacity in North America
12.3.4.2. Analysis of Plasmid DNA Manufacturing Capacity in Europe
12.3.4.3. Analysis of Plasmid DNA Manufacturing Capacity in Asia-Pacific and Rest of the World
12.4. Concluding Remarks
13.1. Chapter Overview
13.2. Key Assumptions and Methodology
13.3. Global Demand for Plasmid DNA
13.3.1. Analysis by Scale of Operation
13.3.1.1. Commercial Demand for Plasmid DNA, Historical Trends (Since 2023) and Forecasted Estimates (Till 2035)
13.3.1.2. Clinical Demand for Plasmid DNA, Historical Trends (Since 2023) and Forecasted Estimates (Till 2035)
13.3.2. Analysis by Application Area
13.3.2.1. Overall Plasmid DNA Demand for Viral Vector Manufacturing, Historical Trends (Since 2023) and Forecasted Estimates (Till 2035)
13.3.2.2. Overall Plasmid DNA Demand for Gene Therapy Manufacturing, Historical Trends (Since 2023) and Forecasted Estimates (Till 2035)
13.3.2.3. Overall Plasmid DNA Demand for Cell Therapy Manufacturing, Historical Trends (Since 2023) and Forecasted Estimates (Till 2035)
13.3.2.4. Overall Plasmid DNA Demand for DNA Vaccine Manufacturing, Historical Trends (Since 2023) and Forecasted Estimates (Till 2035)
13.3.2.5. Overall Plasmid DNA Demand for mRNA Therapy Manufacturing, Historical Trends (Since 2023) and Forecasted Estimates (Till 2035)
13.3.3. Analysis by Geography
13.3.3.1. Overall Demand for Plasmid DNA in North America, Historical Trends (Since 2023) and Forecasted Estimates (Till 2035)
13.3.3.2. Overall Demand for Plasmid DNA in Europe, Historical Trends (Since 2023) and Forecasted Estimates (Till 2035)
13.3.3.3. Overall Demand for Plasmid DNA in Asia-Pacific, Historical Trends (Since 2023) and Forecasted Estimates (Till 2035)
13.3.3.4. Overall Demand for Plasmid DNA in Latin America, Historical Trends (Since 2023) and Forecasted Estimates (Till 2035)
13.3.3.5. Overall Demand for Plasmid DNA in Middle East and North Africa, Historical Trends (Since 2023) and Forecasted Estimates (Till 2035)
13.3.3.6. Overall Demand for Plasmid DNA in Rest of the World, Historical Trends (Since 2023) and Forecasted Estimates (Till 2035)
14.1. Chapter Overview
14.2. Market Drivers
14.3. Market Restraints
14.4. Market Opportunities
14.5. Market Challenges
14.6. Conclusion
15.1. Chapter Overview
15.2. Key Assumptions and Methodology
15.3. Global Plasmid DNA Manufacturing Market, Historical Trends (Since 2023) and Forecasted Estimates (Till 2035)
15.3.1. Scenario Analysis
15.3.1.1. Conservative Scenario
15.3.1.2. Optimistic Scenario
15.4. Key Market Segmentation
16.1. Chapter Overview
16.2. Key Assumptions and Methodology
16.3. Plasmid DNA Manufacturing Market: Distribution by Scale of Operation
16.3.1. Plasmid DNA Manufacturing Market for Commercial Scale of Operation: Historical Trends (Since 2023) and Forecasted Estimates (Till 2035)
16.3.2. Plasmid DNA Manufacturing Market for Clinical Scale of Operation: Historical Trends (Since 2023) and Forecasted Estimates (Till 2035)
16.3.3. Plasmid DNA Manufacturing Market for Preclinical Scale of Operation: Historical Trends (Since 2023) and Forecasted Estimates (Till 2035)
16.4. Data Triangulation and Validation
17.1. Chapter Overview
17.2. Key Assumptions and Methodology
17.3. Plasmid DNA Manufacturing Market: Distribution by Grade of Plasmid DNA
17.3.1. Plasmid DNA Manufacturing Market for GMP Grade Plasmid DNA: Historical Trends (Since 2023) and Forecasted Estimates (Till 2035)
17.3.2. Plasmid DNA Manufacturing Market for High-Quality Plasmid DNA: Historical Trends (Since 2023) and Forecasted Estimates (Till 2035)
17.3.3. Plasmid DNA Manufacturing Market for Research Grade Plasmid DNA: Historical Trends (Since 2023) and Forecasted Estimates (Till 2035)
17.4. Data Triangulation and Validation
18.1. Chapter Overview
18.2. Key Assumptions and Methodology
18.3. Plasmid DNA Manufacturing Market: Distribution by Application Area
18.3.1. Plasmid DNA Manufacturing Market for Viral Vector Manufacturing: Historical Trends (Since 2023) and Forecasted Estimates (Till 2035)
18.3.2. Plasmid DNA Manufacturing Market for Gene Therapy Manufacturing: Historical Trends (Since 2023) and Forecasted Estimates (Till 2035)
18.3.3. Plasmid DNA Manufacturing Market for Cell Therapy Manufacturing: Historical Trends (Since 2023) and Forecasted Estimates (Till 2035)
18.3.4. Plasmid DNA Manufacturing Market for DNA Vaccine Manufacturing: Historical Trends (Since 2023) and Forecasted Estimates (Till 2035)
18.3.5. Plasmid DNA Manufacturing Market for mRNA Vaccine Manufacturing: Historical Trends (Since 2023) and Forecasted Estimates (Till 2035)
18.4. Data Triangulation and Validation
19.1. Chapter Overview
19.2. Key Assumptions and Methodology
19.3. Plasmid DNA Manufacturing Market: Distribution by Therapeutic Area
19.3.1. Plasmid DNA Manufacturing Market for Oncological Disorders: Historical Trends (Since 2023) and Forecasted Estimates (Till 2035)
19.3.2. Plasmid DNA Manufacturing Market for Genetic Disorders: Historical Trends (Since 2023) and Forecasted Estimates (Till 2035)
19.3.3. Plasmid DNA Manufacturing Market for Infectious Disorders: Historical Trends (Since 2023) and Forecasted Estimates (Till 2035)
19.3.4. Plasmid DNA Manufacturing Market for Other Disorders: Historical Trends (Since 2023) and Forecasted Estimates (Till 2035)
19.4. Data Triangulation and Validation
20.1. Chapter Overview
20.2. Key Assumptions and Methodology
20.3. Plasmid DNA Manufacturing Market: Distribution by End User
20.3.1. Plasmid DNA Manufacturing Market for Pharma / Biotech Companies: Historical Trends (Since 2023) and Forecasted Estimates (Till 2035)
20.3.2. Plasmid DNA Manufacturing Market for Academic and Research Institutes: Historical Trends (Since 2023) and Forecasted Estimates (Till 2035)
20.3.3. Plasmid DNA Manufacturing Market for Other End-Users: Historical Trends (Since 2023) and Forecasted Estimates (Till 2035)
20.4. Data Triangulation and Validation
21.1. Chapter Overview
21.2. Key Assumptions and Methodology
21.3. Plasmid DNA Manufacturing Market: Distribution by Geographical Regions
21.3.1. Plasmid DNA Manufacturing Market in North America: Historical Trends (Since 2023) and Forecasted Estimates (Till 2035)
21.3.2. Plasmid DNA Manufacturing Market in Europe: Historical Trends (Since 2023) and Forecasted Estimates (Till 2035)
21.3.3. Plasmid DNA Manufacturing Market in Asia-Pacific: Historical Trends (Since 2023) and Forecasted Estimates (Till 2035)
21.3.4. Plasmid DNA Manufacturing Market in Latin America: Historical Trends (Since 2023) and Forecasted Estimates (Till 2035)
21.3.5. Plasmid DNA Manufacturing Market in Middle East and North Africa: Historical Trends (Since 2023) and Forecasted Estimates (Till 2035)
21.3.6. Plasmid DNA Manufacturing Market in Rest of the World: Historical Trends (Since 2023) and Forecasted Estimates (Till 2035)
21.4. Data Triangulation and Validation
22.1. Chapter Overview
23.1. Chapter Overview
23.2. Company A
23.2.1. Company Snapshot
23.2.2. Interview Transcript: Chief Executive Officer and Co-Founder
23.3. Company B
23.3.1. Company Snapshot
23.3.2. Interview Transcript: Senior Director
23.4. Company C
23.4.1. Company Snapshot
23.4.2. Interview Transcript: Senior Director Commercial
23.5. Company D
23.5.1. Company Snapshot
23.5.2. Interview Transcript: Business Development Manager
23.6. Company E
23.6.1. Company Snapshot
23.6.2. Interview Transcript: Client Engagement Manager
23.7. Company F
23.7.1. Company Snapshot
23.7.2. Interview Transcript: Founder
23.8. Company G
23.8.1. Company Snapshot
23.8.2. Interview Transcript: Chief Scientific Officer
23.9. Company H
23.9.1. Company Snapshot
23.9.2. Interview Transcript: Associate Director
23.10. Company I
23.10.1. Company Snapshot
23.10.2. Interview Transcript: Senior Vice President & General Manager
23.11. Company J
23.11.1. Company Snapshot
23.11.2. Interview Transcript: Vice President, Corporate Development
23.12. Company K
23.12.1. Company Snapshot
23.12.2. Interview Transcript: Senior Scientist
23.13. Company L
23.13.1. Company Snapshot
23.13.2. Interview Transcript: Process Development Scientist
23.14. Company M
23.14.1. Company Snapshot
23.14.2. Interview Transcript: Head of Manufacturing GMP Grade
23.15. Company N
23.15.1. Company Snapshot
23.15.2. Interview Transcript: Chief Technical Officer; Founder; Senior Consultant and Chief Technical Operations Officer
23.16. Company O
23.16.1. Company Snapshot
23.16.2. Interview Transcript: Technical Support for Plasmid DNA Platform
23.17. Company P
23.17.1. Company Snapshot
23.17.2. Interview Transcript: Global CMC Manager
Figure 2.1 Research Methodology: Project Methodology
Figure 2.2 Research Methodology: Data Sources for Secondary Research
Figure 2.3 Research Methodology: Robust Quality Control
Figure 3.1 Market Dynamics: Forecast Methodology
Figure 3.2 Market Dynamics: Market Assessment Framework
Figure 4.1 Lessons Learnt from Past Recessions
Figure 5.1 Executive Summary: Market Landscape
Figure 5.2 Executive Summary: Market Trends (I/II)
Figure 5.3 Executive Summary: Market Trends (II/II)
Figure 5.4 Executive Summary: Market Forecast and Opportunity Analysis
Figure 6.1 Structure of a Plasmid DNA
Figure 6.2 Steps Involved in Plasmid DNA Manufacturing
Figure 6.3 Challenges Associated with Plasmid DNA Manufacturing
Figure 7.1 Plasmid DNA Service Providers: Distribution by Year of Establishment
Figure 7.2 Plasmid DNA Service Providers: Distribution by Company Size
Figure 7.3 Plasmid DNA Service Providers: Distribution by Location of Headquarters (Region)
Figure 7.4 Plasmid DNA Service Providers: Distribution by Location of Headquarters (Country)
Figure 7.5 Plasmid DNA Service Providers: Distribution by Type of Company
Figure 7.6 Plasmid DNA Service Providers: Distribution by Type of Venture
Figure 7.7 Plasmid DNA Service Providers: Distribution by Type of Service Offered
Figure 7.8 Plasmid DNA Manufacturers: Distribution by Location of Manufacturing Facility
Figure 7.9 Plasmid DNA Service Providers: Distribution by Grade of Plasmid DNA
Figure 7.10 Plasmid DNA Service Providers: Distribution by Scale of Operation
Figure 7.11 Plasmid DNA Service Providers: Distribution by Application Area
Figure 7.12 Plasmid DNA Service Providers: Distribution by Portfolio / Offerings
Figure 8.1 Company Competitiveness Analysis: Overview of Plasmid DNA Manufacturing Service Providers in North America (Peer Group I)
Figure 8.2 Company Competitiveness Analysis: Overview of Plasmid DNA Manufacturing Service Providers in Europe (Peer Group II)
Figure 8.3 Company Competitiveness Analysis: Overview of Plasmid DNA Manufacturing Service Providers in Asia-Pacific (Peer Group III)
Figure 8.4 Company Competitiveness Analysis: Plasmid DNA Manufacturing Service Providers based in North America (Peer Group I)
Figure 8.5 Company Competitiveness Analysis: Plasmid DNA Manufacturing Service Providers based in Europe (Peer Group II)
Figure 8.6 Company Competitiveness Analysis: Plasmid DNA Manufacturing Service Providers based in Asia-Pacific (Peer Group III)
Figure 10.1 Partnerships and Collaborations: Cumulative Year-Wise Trend, Since Pre-2021
Figure 10.2 Partnerships and Collaborations: Distribution by Type of Partnership
Figure 10.3 Partnerships and Collaborations: Distribution by Year and Type of Partnership
Figure 10.4 Partnerships and Collaborations: Distribution by Type of Partner
Figure 10.5 Partnerships and Collaborations: Distribution by Grade of Plasmid DNA
Figure 10.6 Partnerships and Collaborations: Distribution by Scale of Operation
Figure 10.7 Most Active Players: Distribution by Number of Partnerships
Figure 10.8 Partnerships and Collaborations: Local and International Agreements
Figure 10.9 Partnerships and Collaborations: Intercontinental and Intracontinental Agreements
Figure 11.1 Acquisitions: Cumulative Year-Wise Trend, Since Pre-2021
Figure 11.2 Acquisitions: Distribution by Type of Acquisition
Figure 11.3 Acquisitions: Distribution by Year and Type of Acquisition
Figure 11.4 Acquisitions: Distribution by Type of Company
Figure 11.5 Acquisitions: Distribution by Business Globalization
Figure 11.6 Acquisitions: Distribution by Portfolio Addition / Expansion
Figure 11.7 Acquisitions: Distribution of Type of Acquisition by Company Size of Acquirer Company
Figure 11.8 Acquisitions: Distribution of Amount by Year and Type of Acquisitions
Figure 11.9 Most Active Players: Distribution by Number of Acquisitions
Figure 11.10 Acquisitions: Local and International
Figure 11.11 Acquisitions: Intercontinental and Intracontinental
Figure 12.1 Global Installed Plasmid DNA Manufacturing Capacity (in Liters): Distribution by Company Size
Figure 12.2 Global Installed Plasmid DNA Manufacturing Capacity (in Liters): Distribution by Grade of Plasmid DNA
Figure 12.3 Global Installed Plasmid DNA Manufacturing Capacity (in Liters): Distribution by Scale of Operation
Figure 12.4 Global Installed Plasmid DNA Manufacturing Capacity (in Liters): Distribution by Location of Manufacturing Facility
Figure 12.5 Installed Plasmid DNA Manufacturing Capacity in North America (in Liters)
Figure 12.6 Installed Plasmid DNA Manufacturing Capacity in Europe (in Liters)
Figure 12.7 Installed Plasmid DNA Manufacturing Capacity in Asia-Pacific (in Liters)
Figure 13.1 Global Demand for Plasmid DNA, Historical Trends (Since 2023) and Forecasted Estimates (Till 2035) (In Kgs)
Figure 13.2 Commercial Demand for Plasmid DNA, Historical Trends (Since 2023) and Forecasted Estimates (Till 2035) (In Kgs)
Figure 13.3 Clinical Demand for Plasmid DNA, Historical Trends (Since 2023) and Forecasted Estimates (Till 2035) (In Kgs)
Figure 13.4 Overall Plasmid DNA Demand for Viral Vector Manufacturing, Historical Trends (Since 2023) and Forecasted Estimates (Till 2035) (In Kgs)
Figure 13.5 Overall Plasmid DNA Demand for Gene Therapy Manufacturing, Historical Trends (Since 2023) and Forecasted Estimates (Till 2035) (In Kgs)
Figure 13.6 Overall Plasmid DNA Demand for Cell Therapy Manufacturing, Historical Trends (Since 2023) and Forecasted Estimates (Till 2035) (In Kgs)
Figure 13.7 Plasmid DNA Demand for DNA Vaccine Manufacturing, Historical Trends (Since 2023) and Forecasted Estimates (Till 2035) (In Kgs)
Figure 13.8 Overall Plasmid DNA Demand for mRNA Therapy Manufacturing, Historical Trends (2020-2025) And Forecasted Estimates (Till 2035) (In Kgs)
Figure 13.9 Overall Demand for Plasmid DNA in North America, Historical Trends (Since 2023) and Forecasted Estimates (Till 2035) (In Kgs)
Figure 13.10 Overall Demand for Plasmid DNA in Europe, Historical Trends (Since 2023) and Forecasted Estimates (Till 2035) (In Kgs)
Figure 13.11 Overall Demand for Plasmid DNA in Asia-Pacific, Historical Trends (Since 2023) and Forecasted Estimates (Till 2035) (In Kgs)
Figure 13.12 Overall Demand for Plasmid DNA in Latin America, Historical Trends (Since 2023) and Forecasted Estimates (Till 2035) (In Kgs)
Figure 13.13 Overall Demand for Plasmid DNA in Middle East and North Africa, Historical Trends (Since 2023) and Forecasted Estimates Till 2035) (In Kgs)
Figure 13.14 Overall Demand for Plasmid DNA in Rest of the World, Historical Trends (Since 2023) and Forecasted Estimates (Till 2035) (In Kgs)
Figure 14.1 Market Drivers
Figure 14.2 Market Restraints
Figure 14.3 Market Opportunities
Figure 14.4 Market Challenges
Figure 15.1 Global Plasmid DNA Manufacturing Market, Historical Trends (Since 2023) and Forecasted Estimates (Till 2035) (USD Million)
Figure 15.2 Global Plasmid DNA Manufacturing Market, Forecasted Estimates (Till 2035), Conservative Scenario (USD Million)
Figure 15.3 Global Plasmid DNA Manufacturing Market, Forecasted Estimates (Till 2035), Optimistic Scenario (USD Million)
Figure 16.1 Plasmid DNA Manufacturing Market: Distribution by Scale of Operation
Figure 16.2 Plasmid DNA Manufacturing Market for Commercial Scale of Operation, Historical Trends (Since 2023) and Forecasted Estimates (Till 2035) (USD Million)
Figure 16.3 Plasmid DNA Manufacturing Market for Clinical Scale of Operation, Historical Trends (Since 2023) and Forecasted Estimates (Till 2035) (USD Million)
Figure 16.4 Plasmid DNA Manufacturing Market for Preclinical Scale of Operation, Historical Trends (Since 2023) and Forecasted Estimates (Till 2035) (USD Million)
Figure 17.1 Plasmid DNA Manufacturing Market: Distribution by Grade of Plasmid DNA
Figure 17.2 Plasmid DNA Manufacturing Market for GMP Grade Plasmid DNA, Historical Trends (Since 2023) and Forecasted Estimates (Till 2035) (USD Million)
Figure 17.3 Plasmid DNA Manufacturing Market for High Quality Plasmid DNA, Historical Trends (Since 2023) and Forecasted Estimates (Till 2035) (USD Million)
Figure 17.4 Plasmid DNA Manufacturing Market for Research Grade Plasmid DNA, Historical Trends (Since 2023) and Forecasted Estimates (Till 2035) (USD Million)
Figure 18.1 Plasmid DNA Manufacturing Market: Distribution by Application Area
Figure 18.2 Plasmid DNA Manufacturing Market for Viral Vector Manufacturing, Historical Trends (Since 2023) and Forecasted Estimates (Till 2035) (USD Million)
Figure 18.3 Plasmid DNA Manufacturing Market for Gene Therapy Manufacturing, Historical Trends (Since 2023) and Forecasted Estimates (Till 2035) (USD Million)
Figure 18.4 Plasmid DNA Manufacturing Market for Cell Therapy Manufacturing, Historical Trends (Since 2023) and Forecasted Estimates (Till 2035) (USD Million)
Figure 18.5 Plasmid DNA Manufacturing Market for DNA Vaccine Manufacturing, Historical Trends (Since 2023) and Forecasted Estimates (Till 2035) (USD Million)
Figure 18.6 Plasmid DNA Manufacturing Market for mRNA Vaccine Manufacturing, Historical Trends (Since 2023) and Forecasted Estimates (Till 2035) (USD Million)
Figure 19.1 Plasmid DNA Manufacturing Market: Distribution by Therapeutic Area
Figure 19.2 Plasmid DNA Manufacturing Market for Oncological Disorders, Historical Trends (Since 2023) and Forecasted Estimates (Till 2035) (USD Million)
Figure 19.3 Plasmid DNA Manufacturing Market for Genetic Disorders, Historical Trends (Since 2023) and Forecasted Estimates (Till 2035) (USD Million)
Figure 19.4 Plasmid DNA Manufacturing Market for Infectious Disorders, Historical Trends (Since 2023) and Forecasted Estimates (Till 2035) (USD Million)
Figure 19.5 Plasmid DNA Manufacturing Market for Other Disorders, Historical Trends (Since 2023) and Forecasted Estimates (Till 2035) (USD Million)
Figure 20.1 Plasmid DNA Manufacturing Market: Distribution by End-Users
Figure 20.2 Plasmid DNA Manufacturing Market for Pharma / Biotech Companies, Historical Trends (Since 2023) and Forecasted Estimates (Till 2035) (USD Million
Figure 20.3 Plasmid DNA Manufacturing Market for Academic and Research Institutes, Historical Trends (Since 2023) and Forecasted Estimates (Till 2035) (USD Million)
Figure 20.4 Plasmid DNA Manufacturing Market for Other End-Users, Historical Trends (Since 2023) and Forecasted Estimates (Till 2035) (USD Million)
Figure 21.1 Plasmid DNA Manufacturing Market: Distribution by Geographical Regions
Figure 21.2 Plasmid DNA Manufacturing Market in North America, Historical Trends (Since 2023) and Forecasted Estimates (Till 2035) (USD Million)
Figure 21.3 Plasmid DNA Manufacturing Market in Europe, Historical Trends (Since 2023) and Forecasted Estimates (Till 2035) (USD Million)
Figure 21.4 Plasmid DNA Manufacturing Market in Asia-Pacific, Historical Trends (Since 2023) and Forecasted Estimates (Till 2035) (USD Million)
Figure 21.5 Plasmid DNA Manufacturing Market in Latin America, Historical Trends (Since 2023) and Forecasted Estimates (Till 2035) (USD Million)
Figure 21.6 Plasmid DNA Manufacturing Market in Middle East and North Africa, Historical Trends (Since 2023) and Forecasted Estimates (Till 2035) (USD Million)
Figure 21.7 Plasmid DNA Manufacturing Market in Rest of the World, Historical Trends (Since 2023) and Forecasted Estimates (Till 2035) (USD Million)
Figure 22.1 Concluding Remarks: Plasmid DNA Manufacturing Market Landscape
Figure 22.2 Concluding Remarks: Plasmid DNA Manufacturing Partnerships and Collaborations
Figure 22.3 Concluding Remarks: Plasmid DNA Manufacturing Acquisitions
Figure 22.4 Concluding Remarks: Plasmid DNA Manufacturing Capacity Analysis Manufacturing Demand Analysis
Figure 22.5 Concluding Remarks: Plasmid DNA Manufacturing Market
Table 7.1 List of Plasmid DNA Service Providers
Table 7.2 Plasmid DNA Service Providers: Information on Type of Service Offered
Table 7.3 Plasmid DNA Manufacturing Service Providers: Information on Location of Manufacturing Facility
Table 7.4 Plasmid DNA Service Providers: Information on Grade of Plasmid DNA
Table 7.5 Plasmid DNA Service Providers: Information on Scale of Operation
Table 7.6 Plasmid DNA Service Providers: Information on Application Area
Table 7.7 Plasmid DNA Service Providers: Portfolio / Offerings
Table 8.1 Company Competitiveness Analysis: Plasmid DNA Manufacturing Service Providers Based in North America (Peer Group I)
Table 8.2 Company Competitiveness Analysis: Plasmid DNA Manufacturing Service Providers Based in Europe (Peer Group II)
Table 8.3 Company Competitiveness Analysis: Plasmid DNA Manufacturing Service Providers Based in Asia-Pacific (Peer Group III)
Table 9.1 List of Companies Profiled
Table 9.2 AGC Biologics: Company Overview
Table 9.3 AGC Biologics: Service Portfolio
Table 9.4 Aldevron (acquired by Danaher): Company Overview
Table 9.5 Aldevron (acquired by Danaher): Service Portfolio
Table 9.6 Catalent Pharma Solutions (acquired by Novo Nordisk): Company Overview
Table 9.7 Catalent Pharma Solutions: Service Portfolio
Table 9.8 Charles River Laboratories: Company Overview
Table 9.9 Charles River Laboratories: Service Portfolio
Table 9.10 GenScript ProBio (a subsidiary of GenScript): Company Overview
Table 9.11 GenScript ProBio (a subsidiary of GenScript): Service Portfolio
Table 9.12 PackGene Biotech: Company Overview
Table 9.13 PackGene Biotech: Service Portfolio
Table 9.14 VectorBuilder: Company Overview
Table 9.15 VectorBuilder: Service Portfolio
Table 9.16 VGXI: Company Overview
Table 9.17 VGXI: Service Portfolio
Table 9.18 WuXi ATU (a subsidiary of WuXi AppTec): Company Overview
Table 9.19 WuXi ATU (a subsidiary of WuXi AppTec): Service Portfolio
Table 9.20 Sartorius: Company Overview
Table 9.21 Sartorius: Service Portfolio
Table 9.22 53Biologics: Company Overview
Table 9.23 53Biologics: Service Portfolio
Table 9.24 ANEMOCYTE: Company Overview
Table 9.25 ANEMOCYTE: Service Portfolio
Table 9.26 Sartorius: Company Overview
Table 9.27 Sartorius: Service Portfolio
Table 9.28 Aurigene Pharmaceutical Services: Company Overview
Table 9.29 Aurigene Pharmaceutical Services: Service Portfolio
Table 9.30 BioCina: Company Overview
Table 9.31 BioCina: Service Portfolio
Table 9.32 3PBiovian: Company Overview
Table 9.33 3PBiovian: Service Portfolio
Table 9.34 Boehringer Ingelheim BioXcellence: Company Overview
Table 9.35 Boehringer Ingelheim BioXcellence: Service Portfolio
Table 9.36 Cytovance Biologics: Company Overview
Table 9.37 Cytovance Biologics: Service Portfolio
Table 9.38 Esco Aster (a subsidiary of Esco Lifesciences): Company Overview
Table 9.39 Esco Aster (a Subsidiary of Esco Lifesciences): Service Portfolio
Table 9.40 Eurogentec (a subsidiary of Kaneka): Company Overview
Table 9.41 Eurogentec (a subsidiary of Kaneka): Service Portfolio
Table 9.42 Forge Biologics: Company Overview
Table 9.43 Forge Biologics: Service Portfolio
Table 9.44 Hanmi Bio Plant (a Subsidiary of Hanmi Pharm): Company Overview
Table 9.45 Hanmi Bio Plant (a Subsidiary of Hanmi Pharm): Service Portfolio
Table 9.46 NorthX Biologics: Company Overview
Table 9.47 NorthX Biologics: Service Portfolio
Table 9.48 Patheon pharma services (acquired by Thermo Fisher Scientific): Company Overview
Table 9.49 Patheon pharma services (acquired by Thermo Fisher Scientific): Service Portfolio
Table 9.50 Richter-Helm BioLogics: Company Overview
Table 9.51 Richter-Helm BioLogics: Service Portfolio
Table 9.52 Southern RNA: Company Overview
Table 9.53 Southern RNA: Service Portfolio
Table 10.1 Plasmid DNA Service Providers: List of Partnerships and Collaborations
Table 11.1 Plasmid DNA Manufacturing Service Providers: List of Acquisitions, Since Pre-2021
Table 12.1 Plasmid DNA Manufacturers: Information on Production Capacity (Sample Dataset)
Table 12.2 Installed Plasmid DNA Manufacturing Capacity: Average Capacity Per Facility based on Company Size (Sample Dataset)
Table 12.3 Plasmid DNA Manufacturers: Global Plasmid DNA Production Capacity
Table 24.1 Plasmid DNA Service Providers: Distribution by Year of Establishment
Table 24.2 Plasmid DNA Service Providers: Distribution by Company Size
Table 24.3 Plasmid DNA Service Providers: Distribution by Location of Headquarters
Table 24.4 Plasmid DNA Service Providers: Distribution by Type of Company
Table 24.5 Plasmid DNA Service Providers: Distribution by Type of Venture
Table 24.6 Plasmid DNA Service Providers: Distribution by Type of Service Offered
Table 24.7 Plasmid DNA Manufacturers: Distribution by Location of Manufacturing Facility
Table 24.8 Plasmid DNA Service Providers: Distribution by Key Offerings
Table 24.9 Plasmid DNA Service Providers: Distribution by Grade of Plasmid DNA
Table 24.10 Plasmid DNA Service Providers: Distribution by Scale of Operation
Table 24.11 Plasmid DNA Service Providers: Distribution by Application Area
Table 24.12 Partnerships and Collaborations: Cumulative Year-Wise Trend, Pre-2021-2026
Table 24.13 Partnerships and Collaborations: Distribution by Type of Partnership
Table 24.14 Partnerships and Collaborations: Distribution by Year and Type of Partnership
Table 24.15 Partnerships and Collaborations: Distribution by Type of Partner
Table 24.16 Partnerships and Collaborations: Distribution by Type of Partner (Specific)
Table 24.17 Partnerships and Collaborations: Distribution by Grade of Plasmid DNA
Table 24.18 Partnerships and Collaborations: Distribution by Scale of Operation
Table 24.19 Most Active Players: Distribution by Number of Partnerships
Table 24.20 Partnerships and Collaborations: Local and International Agreements
Table 24.21 Partnerships and Collaborations: Intercontinental and Intracontinental Agreements
Table 24.22 Acquisitions: Cumulative Year-Wise Trend, Pre-2021-2026
Table 24.23 Acquisitions: Distribution by Type of Acquisition
Table 24.24 Acquisitions: Distribution by Type of Company
Table 24.25 Acquisitions: Distribution by Business Globalization
Table 24.26 Acquisitions: Distribution by Portfolio Addition / Expansion
Table 24.27 Acquisitions: Distribution by Type of Acquisition by Company Size
Table 24.28 Most Active Players: Distribution by Number of Acquisitions
Table 24.29 Acquisitions: Local and International Deals
Table 24.30 Acquisitions: Intercontinental and Intracontinental Deals
Table 24.31 Global Installed Plasmid DNA Manufacturing Capacity (in Liters): Distribution by Company Size
Table 24.32 Global Installed Plasmid DNA Manufacturing Capacity (in Liters): Distribution by Grade of Plasmid DNA
Table 24.33 Global Installed Plasmid DNA Manufacturing Capacity (in Liters): Distribution by Scale of Operation
Table 24.34 Global Installed Plasmid DNA Manufacturing Capacity (in Liters): Distribution by Location of Manufacturing Facility
Table 24.35 Global Demand for Plasmid DNA, Historical Trends (Since 2023) and Forecasted Estimates (Till 2035) (In Kgs)
Table 24.36 Commercial Demand for Plasmid DNA, Historical Trends (Since 2023) and Forecasted Estimates (Till 2035) (In Kgs)
Table 24.37 Clinical Demand for Plasmid DNA, Historical Trends (Since 2023) and Forecasted Estimates (Till 2035) (In Kgs)
Table 24.38 Overall Plasmid DNA Demand for Viral Vector Manufacturing, Historical Trends (Since 2023) and Forecasted Estimates (Till 2035) (In Kgs)
Table 24.39 Overall Plasmid DNA Demand for Gene Therapy Manufacturing, Historical Trends (Since 2023) and Forecasted Estimates (Till 2035) (In Kgs)
Table 24.40 Overall Plasmid DNA Demand for Cell Therapy Manufacturing, Historical Trends (Since 2023) and Forecasted Estimates (Till 2035) (In Kgs)
Table 24.41 Overall Plasmid DNA Demand for DNA Vaccine Manufacturing, Historical Trends (Since 2023) and Forecasted Estimates (Till 2035) (In Kgs)
Table 24.42 Overall Plasmid DNA Demand for mRNA Therapy Manufacturing, Historical Trends (Since 2023) And Forecasted Estimates (Till 2035) (In Kgs)
Table 24.43 Overall Plasmid DNA Demand in North America, Historical Trends (Since 2023) and Forecasted Estimates (Till 2035) (In Kgs)
Table 24.44 Overall Plasmid DNA Demand in Europe, Historical Trends (Since 2023) and Forecasted Estimates (Till 2035) (In Kgs)
Table 24.45 Overall Plasmid DNA Demand in Asia-Pacific, Historical Trends (Since 2023) and Forecasted Estimates (Till 2035) (In Kgs)
Table 24.46 Overall Plasmid DNA Demand in Latin America, Historical Trends (Since 2023) and Forecasted Estimates (Till 2035) (In Kgs)
Table 24.47 Overall Plasmid DNA Demand in Middle East and North America, Historical Trends (Since 2023) and Forecasted Estimates (Till 2035) (In Kgs)
Table 24.48 Overall Plasmid DNA Demand in Rest of the World, Historical Trends (Since 2023) and Forecasted Estimates (Till 2035) (In Kgs)
Table 24.49 Global Plasmid DNA Manufacturing Market, Historical Trends (Since 2023) and Forecasted Estimates (Till 2035) (USD Million)
Table 24.50 Global Plasmid DNA Manufacturing Market, Forecasted Estimates (Till 2035): Conservative Scenario (USD Million)
Table 24.51 Global Plasmid DNA Manufacturing Market, Forecasted Estimates (Till 2035): Optimistic Scenario (USD Million)
Table 24.52 Plasmid DNA Manufacturing Market: Distribution by Scale of Operation (USD Million)
Table 24.53 Plasmid DNA Manufacturing Market for Commercial Scale of Operation, Historical Trends (Since 2023) and Forecasted Estimates (Till 2035) (USD Million)
Table 24.54 Plasmid DNA Manufacturing Market for Clinical Scale of Operation, Historical Trends (Since 2023) and Forecasted Estimates (Till 2035) (USD Million)
Table 24.55 Plasmid DNA Manufacturing Market for Preclinical Scale of Operation, Historical Trends (Since 2023) and Forecasted Estimates (Till 2035) (USD Million)
Table 24.56 Plasmid DNA Manufacturing Market: Distribution by Grade of Plasmid DNA (USD Million)
Table 24.57 Plasmid DNA Manufacturing Market for GMP Grade Plasmid DNA, Historical Trends (Since 2023) and Forecasted Estimates (Till 2035) (USD Million)
Table 24.58 Plasmid DNA Manufacturing Market for High Quality Plasmid DNA, Historical Trends (Since 2023) and Forecasted Estimates (Till 2035) (USD Million)
Table 24.59 Plasmid DNA Manufacturing Market for Research Grade Plasmid DNA, Historical Trends (Since 2023) and Forecasted Estimates (Till 2035) (USD Million)
Table 24.60 Plasmid DNA Manufacturing Market: Distribution by Application Area (USD Million)
Table 24.61 Plasmid DNA Manufacturing Market for Viral Vector Manufacturing, Historical Trends (Since 2023) and Forecasted Estimates (Till 2035) (USD Million)
Table 24.62 Plasmid DNA Manufacturing Market for Gene Therapy Manufacturing, Historical Trends (Since 2023) and Forecasted Estimates (Till 2035) (USD Million)
Table 24.63 Plasmid DNA Manufacturing Market for Cell Therapy Manufacturing, Historical Trends (Since 2023) and Forecasted Estimates (Till 2035) (USD Million)
Table 24.64 Plasmid DNA Manufacturing Market for DNA Vaccines Manufacturing, Historical Trends (Since 2023) and Forecasted Estimates (Till 2035) (USD Million)
Table 24.65 Plasmid DNA Manufacturing Market for mRNA Vaccine Manufacturing, Historical Trends (Since 2023) and Forecasted Estimates (Till 2035) (USD Million)
Table 24.66 Plasmid DNA Manufacturing Market: Distribution by Therapeutic Area (USD Million)
Table 24.67 Plasmid DNA Manufacturing Market for Oncological Disorders, Historical Trends (Since 2023) and Forecasted Estimates (Till 2035) (USD Million)
Table 24.68 Plasmid DNA Manufacturing Market for Genetic Diseases, Historical Trends (Since 2023) and Forecasted Estimates (Till 2035) (USD Million)
Table 24.69 Plasmid DNA Manufacturing Market for Infectious Disorders, Historical Trends (Since 2023) and Forecasted Estimates (Till 2035) (USD Million)
Table 24.70 Plasmid DNA Manufacturing Market for Other Disorders, Historical Trends (Since 2023) and Forecasted Estimates (Till 2035) (USD Million)
Table 24.71 Plasmid DNA Manufacturing Market: Distribution by End-User (USD Million)
Table 24.72 Plasmid DNA Manufacturing Market for Pharma / Biotech Companies, Historical Trends (Since 2023) and Forecasted Estimates (Till 2035) (USD Million)
Table 24.73 Plasmid DNA Manufacturing Market for Academic and Research Institutes, Historical Trends (Since 2023) and Forecasted Estimates (Till 2035) (USD Million)
Table 24.74 Plasmid DNA Manufacturing Market for Other End-Users, Historical Trends (Since 2023) and Forecasted Estimates (Till 2035) (USD Million)
Table 24.75 Plasmid DNA Manufacturing Market: Distribution by Geographical Regions (USD Million)
Table 24.76 Plasmid DNA Manufacturing Market in North America, Historical Trends (Since 2023) and Forecasted Estimates (Till 2035) (USD Million)
Table 24.77 Plasmid DNA Manufacturing Market in Europe, Historical Trends (Since 2023) and Forecasted Estimates (Till 2035) (USD Million)
Table 24.78 Plasmid DNA Manufacturing Market in Asia-Pacific, Historical Trends (Since 2023) and Forecasted Estimates (Till 2035) (USD Million)
Table 24.79 Plasmid DNA Manufacturing Market in Latin America, Historical Trends (Since 2023) and Forecasted Estimates (Till 2035) (USD Million)
Table 24.80 Plasmid DNA Manufacturing Market in Middle East and North Africa, Historical Trends (Since 2023) and Forecasted Estimates (Till 2035) (USD Million)
Table 24.81 Plasmid DNA Manufacturing Market in Rest of the World, Historical Trends (Since 2023) and Forecasted Estimates (Till 2035) (USD Million)