Electric Vehicle Charging Market by Level of Charging (Level 1, Level 2, and Level 3), Connector Type (CHAdeMO, Combined Charging System, Type 1, Type 2, North American Charging Standard / Tesla Supercharger, GB / T Fast, and Others), Charging Location / Access Type, Operation Mode, Vehicle / Fleet Type Served, Geographical Regions, and Leading Players – Trends and Forecasts 2026-2040
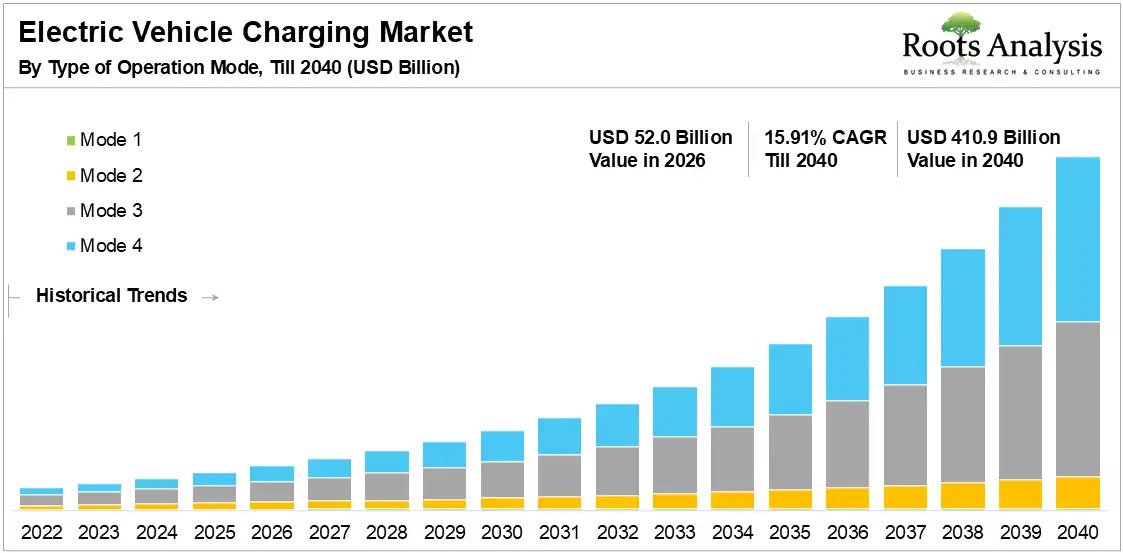
The global electric vehicle charging market reached USD 52.0 Billion in 2026 and will grow to USD 410.9 Billion by 2040, registering a CAGR of 15.91% over the forecast period 2026 to 2040, driven by corridor fast charging, home charging normalization, and fleet depot electrification.
See What’s in the Full Report – Request Your Complimentary Insights!
Market Report: Key Takeaways
Based on level of charging, level 2 captures 48.0% market share in 2026, whereas level 3 registers an 18.8% CAGR through 2040, driven by corridor and fleet fast-charging demand.
With respect to connector type, combined charging system captures 38.0% market share in 2026, whereas GB/T fast registers a 23.6% CAGR through 2040, driven by China’s high-power charging scale.
In terms of charging location / access type, residential / private charging captures 38.0% market share in 2026, whereas fleet / depot charging registers a 20.4% CAGR through 2040, driven by commercial fleet electrification.
Based on vehicle / fleet type served, passenger cars occupy 65.0% market share in 2026, whereas heavy-duty electric trucks registers a 23.4% CAGR through 2040, driven by megawatt freight charging.
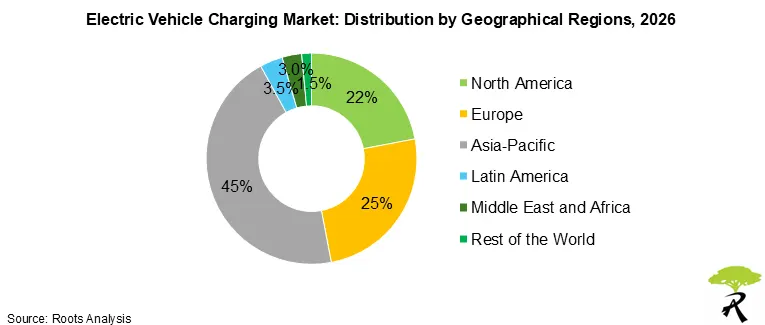
On the basis of geographical insights, Asia-Pacific captures 45.0% market share in 2026, whereas Middle East and Africa registers a 20.2% CAGR through 2040, driven by low-base national network expansion.
Electric Vehicle Charging Market Outlook
The global electric vehicle (EV) charging industry is entering a high-conviction growth phase defined by utilization economics, fleet-scale demand, and accelerating connector standardization. The industry has moved decisively beyond its pilot-network origins. Deployment strategy now centers on high-throughput corridors, commercial depot sites, and shared-access residential properties rather than station counts alone.
Level 2 charging remains the largest installed base, holding 48.0% of market share in 2026. The structural growth story, however, belongs to DC fast charging. Level 3 infrastructure is forecast to expand at an 18.8% CAGR through 2040, driven by a fundamental shift in driver behavior toward shorter dwell times and higher throughput per session. Heavy-duty electric trucks represent the fastest-scaling demand vector, projected at 23.4% CAGR over the same period and creating sustained requirements for megawatt-class hubs and precision-scheduled fleet charging.
Policy frameworks and federal capital programs have provided foundational support, though execution risk remains visible. The USD 7.5 billion National Electric Vehicle Infrastructure program had delivered fewer than 400 ports as of April 2025, exposing a material gap between funding commitments and on-ground deployment velocity. Critically, the constraint is no longer charger supply. Grid interconnection timelines, site power capacity, and payment system reliability now define the critical path for infrastructure scaling.
Private-sector partnerships are moving faster. ChargePoint and OBE Power announced more than 2,500 planned ports across US multifamily residential properties in May 2026, directly addressing the access gap for apartment-dwelling electric vehicle owners without dedicated home charging.
Through 2040, growth will shift toward DC fast charging, fleet depots, and NACS-enabled networks. Pilot, General Motors, and EVgo opened more than 200 fast-charging locations by September 2025. The rollout included nearly 850 stalls across almost 40 US states. Competition will reward uptime, power density, and host access more than hardware volume. The outlook remains high-growth but utilization-driven.
Electric Vehicle Charging Market Size Estimation Methodology
As a starting point, the forecast reconciled public 2026 anchors from multiple credible secondary sources. Scope filters removed high-scope outliers that included broad energy infrastructure beyond EVSE hardware, software, and charging operations. The retained base reflected public, residential, workplace, corridor, depot, and bus charging demand within the EV charging market.
Moving forward, annual growth was mapped against EV adoption, public charging station additions, and charger utilization assumptions. Passenger cars received the largest 2026 demand weight because they hold 65.0% share in vehicle and fleet type served. Heavy-duty electric trucks received the steepest growth curve because their charging segment grows at 23.4% CAGR through 2040. Fleet depot utilization also shaped revenue timing.
Building on this, segment forecasts used bottom-up shares for geography, charging level, connector type, access location, operation mode, and vehicle type. Level 2 kept near-term leadership at 48.0% share in 2026 because homes, apartments, workplaces, and destinations absorb AC charging. Level 3 gained long-term weight because corridor charging, urban hubs, and fleet depots require shorter dwell times.
Drawing upon these, regional values were stress-tested against policy programs, charger deployment announcements, connector standards, and utility-readiness indicators. Asia-Pacific received the largest 2026 allocation because China, India, Japan, and Korea combine EV demand with centralized infrastructure planning. Middle East and Africa received the fastest regional growth curve. National networks, highway sites, and tourism corridors expand from a low base.
The projected value was then converted into annual revenue using a 15.91% headline CAGR through 2040. The curve avoided a straight-line escalation by reflecting slower early federal rollout, faster fleet electrification, and later corridor density gains. Cross-checks used equipment shipment signals, construction cost indices, utility billing data, and power-capacity requirements for high-output sites. Utility interconnection timing shaped deployment phasing and revenue risk.
Finally, the model checked whether segment shares, CAGRs, and narrative drivers stayed internally consistent. Residential charging lost share but remained the largest access type in 2026, while fleet and depot charging gained through higher utilization. Combined Charging System led connector share in 2026, while GB/T Fast and NACS captured stronger growth from high-power regional standardization.
Electric Vehicle Charging Market Share Insights
Market Share by Type of Connector
According to our market forecast, combined charging system holds 38% of the global market share in 2026. This growth is driven by deep installed-base penetration across Europe and North America, automaker compatibility commitments, and certified hardware ecosystems built over the past decade. Regulatory approvals, grid-tied infrastructure investment, and long-term operator contracts create structural inertia that slows near-term displacement even as newer standards gain ground.
ChargePoint reinforced this position in August 2025 with the launch of its Omni Port conversion kit, enabling CCS-equipped stations to serve any new EV regardless of connector type. This is a significant move that extends the commercial life of existing CCS assets while bridging toward multi-standard interoperability.
On the other hand, GB / T fast charging is expected to grow at a CAGR of 23.6% through 2040. China's scaled deployment of high-power charging infrastructure around domestic GB/T standards is redefining utilization benchmarks at the network level.
High-density urban corridors, battery-buffered megawatt sites, and mass-market EV platforms with high charge-acceptance rates are driving rapid throughput gains per station. BYD's March 2025 unveiling of its Super e-Platform, capable of megawatt-class flash charging that matches conventional refueling speeds. It signals the technical trajectory of GB/T Fast as a standard built for volume, speed, and urban density rather than incremental hardware upgrades.
Market Share by Charging Location / Access Type
Based on our analysis, Residential and private charging leads the market , capturing 38% of the global revenue share in 2026. Electric Vehicles parked at home overnight represent the highest-utilization charging window in the daily cycle. Lower installation costs relative to public DC infrastructure, bundled charging offers tied to vehicle purchase, and growing integration with home energy management systems sustain a durable residential revenue base that is difficult for public networks to displace.
Automaker-led programs are deepening this advantage. Ford extended its Power Promise initiative into 2025, covering home charger installation costs for new EV buyers and anchoring residential charging as part of the vehicle ownership proposition rather than an aftermarket decision. This bundling strategy reduces friction at the point of purchase, increases charger attachment rates, and reinforces residential infrastructure as the default energy source for the mass-market EV owner.
Conversely, fleet and depot charging will grow at a higher CAGR of 20.4% during the forecast period. Operators electrifying rideshare, last-mile delivery, logistics, and autonomous vehicle fleets are converting depot sites into high-utilization charging assets with economics that public networks cannot replicate.
Scheduled charging windows, centralized power procurement, and predictable daily throughput allow depot operators to optimize electricity costs, reduce idle time, and align infrastructure investment with contracted fleet capacity.
In February 2026, Uber committed more than USD 100 million toward autonomous vehicle charging infrastructure, directly linking robotaxi fleet expansion to dedicated depot buildout. This investment signals a structural demand pull that extends beyond current rideshare electrification, one where charging infrastructure becomes a prerequisite for autonomous mobility deployment at scale rather than a supporting utility.
Want Information on Specific Region / Segment?
Regional Analysis: Asia-Pacific Holds the Largest Share
Dominant Region: Asia-Pacific Holds 45% of Global Market Share in 2026
Asia-Pacific’s highest share is driven by China's unmatched infrastructure scale, dense EV adoption rates, and vertically integrated domestic charger manufacturing.
China operates the world's largest EV charging network, capable of meeting the demand of more than 40 million new energy vehicles. Total charging facilities reached 20.09 million by end of 2025, with the country doubling its installed base from 10 million to 20 million units in just 18 months, reflecting a deliberate shift toward higher-throughput infrastructure.
Beyond China, India and Southeast Asia are adding incremental growth through public-private rollout models that localize deployment around urban mobility corridors and commercial transport hubs.
Fastest-Growing Region: Middle East and Africa will Grow at 20.2% CAGR Through 2040
Growth is driven by low base penetration, national fleet electrification commitments, Gulf highway corridor programs, and rising premium EV adoption in urban centers. Charging investment is concentrating around tourism routes, logistics hubs, and high-traffic intercity highways where utilization potential is highest.
Saudi Arabia's EVIQ, a joint venture between the Public Investment Fund and Saudi Electricity Company has inaugurated its first highway EV charging station at SASCO Aljazeera on the Riyadh-Qassim highway in March 2025, marking a strategic entry point into long-distance EV travel infrastructure.
The launch is part of EVIQ's broader commitment to deploy more than 5,000 fast chargers by 2030, with near-term expansion planned across the Riyadh-Dammam and Mecca-Madinah highway routes. This sovereign-backed infrastructure push, aligned with Vision 2030 sustainability targets, positions Saudi Arabia as the leading charging deployment market within the MEA region.
Market Ecosystem Analysis
Electric Vehicle Charging Market Competitive Landscape
Seven Tier 1 leaders control most visible activity in this scope; specialists and entrants contest sub-segments. Hardware-software bundling is the dominant consolidation dynamic, reinforced by platform convergence around NACS, V2X, and load-control layers. Public-funding uncertainty has shifted behavior toward privately financed highway, retail, urban, and depot projects, making site economics the primary commercial force now. Competitive advantage is moving from charger count toward power-secure sites, connector flexibility, uptime software, and amenity-led utilization.
Tier 1 Network Operators Converting Fast Charging Into Retail and Fleet Footfall
Large network operators now compete through corridor confidence, payment access, amenities, and fleet usability.
Tesla expanded Supercharger access into European fleet-charging products in November 2025, extending access to over 20,000 charging points. This reinforces platform convergence around payment, roaming, and proprietary network access. It pressures open CPOs to simplify fleet charging across highway corridor and commercial fleet applications.
EVgo’s corridor deployment reached 130 locations across 25 states in March 2025, with 350 kW highway chargers. This pressures smaller public networks because corridor coverage now competes on route confidence and charging availability. It strengthens Level 3 passenger-car charging across highway corridor locations.
Electrify America reported in February 2026 that its 2025 network delivered over 20 million sessions and 750 GWh. That scale strengthens open ultra-fast public charging and raises utilization benchmarks for retail and highway operators. It pressures newer CPOs to prove reliability and driver throughput, not simply charger availability.
Startup Companies Initiatives
Startups are reshaping competitive dynamics in EV charging by targeting gaps in uptime reliability, fleet depot management, and grid-edge energy optimization that incumbent networks have underinvested in. Their ability to deploy asset-light, software-first models is attracting institutional capital and strategic partnerships with utilities, automakers, and logistics operators across North America, Europe, and Asia-Pacific.
Venture and growth capital continues to flow into EV charging startups addressing utilization, grid integration, and fleet-scale managed charging. Early-stage companies are differentiating on software intelligence, payment reliability, and hardware modularity rather than station volume. The most active funding clusters sit at the intersection of energy management, depot automation, and bidirectional charging infrastructure.
Electric Vehicle Charging Market Trends
EV Charging Market Connector Convergence Expanding Addressable Network Access
Connector convergence is turning network coverage into a platform-access problem. EVgo had nearly 100 NACS connectors live in January 2026, with more than 500 planned by year-end. Operators that support NACS early can serve more vehicles without rebuilding entire sites.
Dual-standard charging is reducing driver friction at high-power destinations. IONNA and Circle K announced an April 2026 US partnership with up to 400 kW charging, NACS, and CCS. Retail hosts gain broader customer reach when connector choice stops limiting station visits.
Fleet and Depot Electrification Turning Charging Sites into Utilization Assets
Fleet electrification is shifting charging demand toward scheduled, high-utilization depots. Uber said in February 2026 it would invest over USD 100 million in autonomous vehicle charging. Dedicated depot assets can support stronger revenue visibility than dispersed public charging.
Megawatt truck charging is making freight corridors a specialized infrastructure category. Milence highlighted electric corridors, megawatt charging, and smart booking in June 2025. Hardware suppliers with power density and reservation software can defend premium commercial positions.
Your Business is Unique – Why Shouldn’t Your Report Be?
Market Access Considerations
Domestic Content and Federal Funding Compliance
Buy America compliance determines which suppliers can access federally funded charging projects. The February 2026 proposal to raise domestic-content requirements increases documentation, sourcing, and manufacturing localization pressure. Qualified vendors can win public tenders faster, while import-reliant hardware suppliers face margin pressure and project delays. The rule also favors vertical relationships between equipment makers, installers, and public project developers during procurement review.
Grid Interconnection and High-Power Site Readiness
High-power charging access depends on grid capacity, transformer availability, and utility approval timing. Level 3 charging grows at 18.8% CAGR through 2040 because corridors and fleets need shorter dwell times. These sites need larger power connections than Level 2 assets. Operators with utility relationships and load-management software gain schedule and cost advantages. Battery-buffered designs can reduce peak-grid exposure, but they add capital complexity and maintenance obligations. This makes energization speed a commercial differentiator for high-power network operators.
Connector Standard Coverage and Vehicle Compatibility
Connector coverage shapes market access because drivers avoid stations that cannot serve their vehicle. Combined Charging System leads with 38.0% share in 2026, while NACS gains through high-growth North American compatibility. EVgo’s January 2026 NACS rollout shows why operators must support standard transitions without stranding CCS assets. Hardware vendors must design conversion paths, adapters, and software identification without reducing charger reliability.
Site Host Control Across Residential, Retail, and Corridors
Site control determines utilization because charging revenue follows dwell time, parking access, and repeat visits. ChargePoint and OBE Power targeted more than 2,500 multifamily ports in May 2026, linking charger access to apartment living. The same dynamic supports corridor locations, where fuel-stop partnerships can aggregate long-distance demand. Host exclusivity can block late entrants from prime parking and traffic corridors. CPOs with host contracts can scale faster than hardware suppliers selling one-off equipment.
How Stakeholders Benefit from the Key Focus Areas of Our Electric Vehicle Charging Market Report
EV adoption now makes charging availability a constraint on vehicle sales, fleet conversion, and corridor travel. The report links segment forecasts, connector shifts, deployment examples, and access barriers to decisions on capital allocation, partnerships, and technology roadmaps.
Unmet Needs and Market Gaps in Electric Vehicle Charging Market: The report identifies where charging supply remains misaligned with demand, especially multifamily housing, fleet depots, and highway corridors. Strategy teams can use the gap map to prioritize access locations with higher dwell-time confidence. Operators can decide whether to enter residential, retail, or fleet charging based on utilization potential.
Funding and Venture Investment Opportunities in Electric Vehicle Charging Market: The report separates bankable infrastructure categories from speculative charger rollouts. Infrastructure investors can compare Level 3 growth, fleet and depot CAGR, and heavy-duty truck charging demand. EVgo’s July 2025 USD 225 million loan facility shows how lenders back high-power stall expansion when utilization improves.
Technology Innovation and Adoption Trends: The report tracks NACS, GB/T Fast, CCS, megawatt charging, smart charging management, and vehicle-to-grid readiness. Product leaders can align charger design with regional standards and power-density needs. Software teams can evaluate billing, roaming, load management, and booking functions that protect uptime and site economics.
Electric Vehicle Charging Market Competitive Landscape and Industry Analysis: The report profiles hardware suppliers, charge point operators, software platforms, and site-focused challengers across tier groups. Corporate development teams can benchmark ABB E-mobility, Tesla, ChargePoint, Siemens eMobility, Schneider Electric, EVgo, and Electrify America. Competitive mapping supports partner selection, acquisition screening, and channel strategy.
Mapping Strategic Partnerships and Ecosystem Synergies: The report shows how automakers, retailers, oil companies, utilities, and CPOs combine assets to scale charging networks. Business development teams can assess which partnerships solve site access, energy procurement, connector coverage, or customer acquisition. IONNA and Circle K show how retail hosts and high-power networks can combine convenience sites with 400 kW charging.
Electric Vehicle Charging Market CAGR and Growth Trends: The report quantifies growth by geography, charging level, connector type, location, operation mode, and vehicle type. Planning teams can compare Asia-Pacific share leadership with Middle East and Africa’s faster regional CAGR. Capital committees can use the 15.91% headline CAGR and segment CAGRs to set market-entry timing, pricing, and capacity plans.
Electric Vehicle Charging Market: Scope of the Report
Key Report Attributes
Details
Forecast Period
Till 2040
Market Size 2026
USD 52.0 Billion
Market Size 2040
USD 410.9 Billion
CAGR (Till 2040)
15.91%
Segments Covered
Level of Charging
Connector Type
Charging Location / Access Type
Operation Mode
Fleet / Vehicle Type Served
Geographical Regions Covered
North America, Europe, Asia-Pacific, Latin America, Middle East and Africa, and rest of the world
Key Sections Covered
Global Electric Vehicle Charging Market Forecast
Electric Vehicle Charging Market Landscape
Startup Ecosystem Analysis
Company Competitiveness Analysis
Funding and Investment Analysis
SWOT Analysis
PORTER’s Five Forces Analysis
Unmet Needs Analysis
Recent Developments
Company Profiles
Source: Roots Analysis
Market Segmentation
The electric vehicle charging market report presents an in-depth analysis, highlighting the capabilities of various stakeholders, based on different segments, such as level of charging, connector type, charging location / access type, operation mode, fleet / vehicle type served, geographical regions, and leading players.
By Level of Charging
Level 1
Level 2
Level 3
By Connector Type
CHAdeMO
Combined Charging System
Type 1
Type 2
North American Charging Standard / Tesla Supercharger
GB / T Fast
Others
By Charging Location / Access Type
Residential / Private Charging
Workplace Charging
Public On-street Charging
Retail / Destination Charging
Highway Corridor Charging
Fleet / Depot Charging
Bus Charging
By Operation Mode
Mode 1
Mode 2
Mode 3
Mode 4
By Vehicle / Fleet Type Served
Passenger Cars
Electric Buses
Light Commercial Vehicles
Heavy-Duty Electric Trucks
Two-Wheelers and Micro-mobility Vehicles
Fleet and Rideshare Vehicles
By Geographical Regions
North America
US
Canada
Mexico
Rest of North America
Europe
Austria
Belgium
Denmark
France
Germany
Ireland
Italy
Netherlands
Norway
Russia
Spain
Sweden
Switzerland
UK
Rest of Europe
Asia-Pacific
Australia
China
India
Japan
New Zealand
Singapore
South Korea
Rest of Asia-Pacific
Latin America
Argentina
Brazil
Chile
Colombia
Venezuela
Rest of Latin America
Middle East and Africa (MEA)
Egypt
Iran
Iraq
Israel
Kuwait
Saudi Arabia
UAE
Rest of MEA
Rest of the World
Frequently Asked Questions
What is the global EV charging market size?
The market size is USD 52.0 billion in 2026 and USD 410.9 billion by 2040.
How fast will the EV charging market grow?
It grows at a calculated 15.91% CAGR from 2026 to 2040.
Which charging level dominates EV charging market share?
Level 2 dominates with 48.0% share in 2026, while Level 3 grows fastest at 18.8% CAGR.
Which connector type leads EV charging infrastructure demand?
Combined Charging System leads with 38.0% share in 2026, while GB/T Fast grows fastest at 23.6% CAGR.
Who are the leading EV charging market companies?
Tier 1 leaders include ABB E-mobility, Tesla, ChargePoint, Siemens eMobility, Schneider Electric, EVgo, and Shell Recharge.
Where is the EV charging market most dominant?
Asia-Pacific leads with 45.0% share in 2026, supported by China, India, Japan, and Korea.
Which region grows fastest in EV charging infrastructure?
Middle East and Africa grows fastest at 20.2% CAGR from 2026 to 2040.
What technology drives smart EV charging market growth?
NACS, GB / T Fast, CCS, megawatt charging, load management, and vehicle-to-grid readiness support growth; Mode 4 grows at 19.0% CAGR.
How are investments shaping EV charging infrastructure expansion?
EVgo’s July 2025 USD 225 million loan facility supports more than 1,500 additional high-power fast-charging stalls.
Is regulation accelerating sustainable EV charging deployment?
Regulation shapes deployment through funding and compliance; fewer than 400 federal-program ports by April 2025 show execution risk.
Electric Vehicle Charging Market by Level of Charging (Level 1, Level 2, and Level 3), Connector Type (CHAdeMO, Combined Charging System, Type 1, Type 2, North American Charging Standard / Tesla Supercharger, GB / T Fast, and Others), Charging Location / Access Type, Operation Mode, Vehicle / Fleet Type Served, Geographical Regions, and Leading Players – Trends and Forecasts 2026-2040
Request Sample Pages
Electric Vehicle Charging Market by Level of Charging (Level 1, Level 2, and Level 3), Connector Type (CHAdeMO, Combined Charging System, Type 1, Type 2, North American Charging Standard / Tesla Supercharger, GB / T Fast, and Others), Charging Location / Access Type, Operation Mode, Vehicle / Fleet Type Served, Geographical Regions, and Leading Players – Trends and Forecasts 2026-2040
Ask A Question
Electric Vehicle Charging Market by Level of Charging (Level 1, Level 2, and Level 3), Connector Type (CHAdeMO, Combined Charging System, Type 1, Type 2, North American Charging Standard / Tesla Supercharger, GB / T Fast, and Others), Charging Location / Access Type, Operation Mode, Vehicle / Fleet Type Served, Geographical Regions, and Leading Players – Trends and Forecasts 2026-2040
Download Free Insights
Electric Vehicle Charging Market by Level of Charging (Level 1, Level 2, and Level 3), Connector Type (CHAdeMO, Combined Charging System, Type 1, Type 2, North American Charging Standard / Tesla Supercharger, GB / T Fast, and Others), Charging Location / Access Type, Operation Mode, Vehicle / Fleet Type Served, Geographical Regions, and Leading Players – Trends and Forecasts 2026-2040
Describe Usage
How many people will be using this report?
To help us serve you better, please select the best option that
describes the usage of this report
Thank you for submitting the details. Your message has been sent to the relevant team. One
of our team members will shortly email you the relevant quotation. For any queries, please feel
free to reach out to us at support@rootsanalysis.com
Roots Analysis Customer Support
Open AI tool?
You are leaving Roots Analysis.
(Report title & URL will be shared)